Remove Article Remove Cost-Benefit Remove KPI Remove Visualization
article thumbnail

Take Advantage Of Operational Metrics & KPI Examples – A Comprehensive Guide

datapine

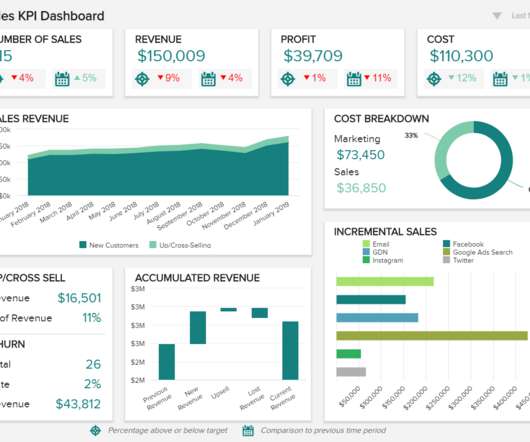
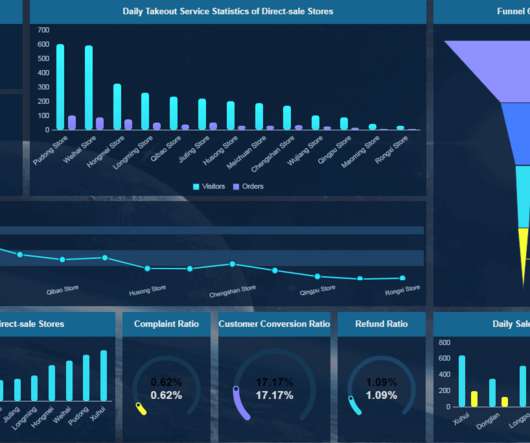
Identifying what is working and what is not is one of the invaluable management practices that can decrease costs, determine the progress a business is making, and compare it to organizational goals. Your Chance: Want to visualize & track operational metrics with ease? What Is An Operational KPI?

KPI 269
article thumbnail

Your Definitive Guide To KPI Tracking By Utilizing Modern Software & Tools

datapine

While there are numerous KPI examples you can choose from, you should pick only the most important ones and focus on the right ones for your business. That said, using the right KPIs is essential to both your immediate and long-term business activities. But first, let’s ask ourselves the question, ‘ What is KPI tracking?’.

KPI 195
Insiders

Sign Up for our Newsletter

This site is protected by reCAPTCHA and the Google Privacy Policy and Terms of Service apply.

article thumbnail

Remove Your Rose Tinted Glasses: Data Visualizations Designed to Mislead

datapine

1) Misleading Data Visualization Examples. 2) How to Avoid Misleading Visuals. 3) The Impact Of Bad Data Visualizations. But while that may be the case, people are duped by data visualizations every day. Bad data visualizations come in many forms, with some more obvious than others. Table of Contents.

article thumbnail

A Beginner’s Guide To Inventory Metrics And Best Practices

datapine

Collecting big amounts of data is not the only thing to do; knowing how to process, analyze, and visualize the insights you gain from it is key. Your Chance: Want to visualize & track inventory KPIs with ease? How To Choose The Right Inventory KPIs? Explore our modern reporting software for 14 days, completely free!

Metrics 286
article thumbnail

Your Definitive Guide To Building Valuable Narratives Through Data Storytelling

datapine

By gaining centralized access to business data and presenting it in a visual way that follows a logical path and provides invaluable insights on a particular area or subject, you stand to set yourself apart from your competitors and become a leader in your field. Data storytelling has a host of business-boosting benefits.

KPI 193
article thumbnail

Your Guide To Modern Agency Analytics, Dashboards & Reporting Techniques

datapine

In this article, we will cover every fundamental aspect to take advantage of agency analytics. Starting with its definition, following with the benefits of agency reports, a list of tools, and a set of agency dashboard examples. Explore our 14 days free trial & benefit from interactive agency reports!

article thumbnail

Top 10 Management Reporting Best Practices To Create Effective Reports

datapine

By the end of this article, making stunning and useful managerial reports will be second nature to you. When these reports are backed up with powerful visualizations developed with a dashboard creator , no information can stay hidden, eliminating thus the possibility of human errors and negative business impact.

Reporting 263