Remove Article Remove Machine Learning Remove Structured Data Remove Visualization
article thumbnail

Must Known Data Visualization Techniques for Data Science

Analytics Vidhya

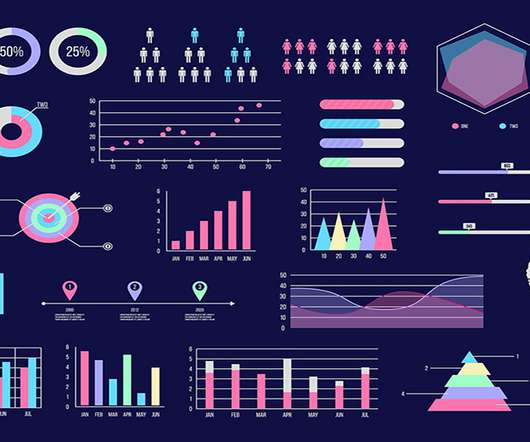
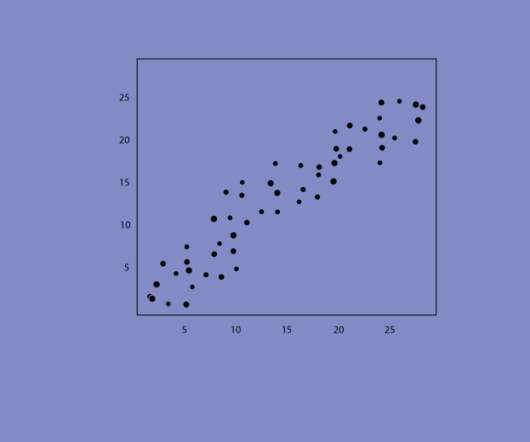
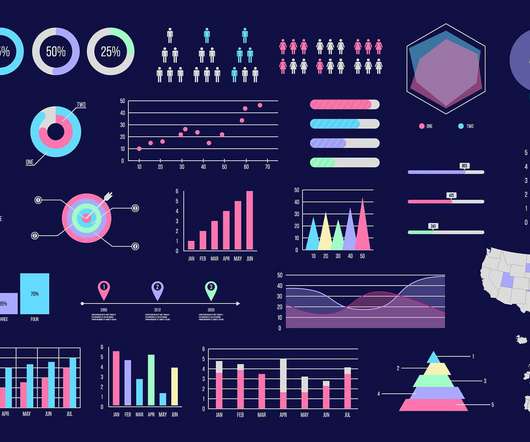
ArticleVideo Book This article was published as a part of the Data Science Blogathon Introduction In applied Statistics and Machine Learning, Data Visualization is one. The post Must Known Data Visualization Techniques for Data Science appeared first on Analytics Vidhya.

article thumbnail

Plotly and cufflinks : Advanced Python Data Visualization Libraries

Analytics Vidhya

ArticleVideo Book This article was published as a part of the Data Science Blogathon Introduction Data Visualization helps to bridge the gap between numbers and. The post Plotly and cufflinks : Advanced Python Data Visualization Libraries appeared first on Analytics Vidhya.

Insiders

Sign Up for our Newsletter

This site is protected by reCAPTCHA and the Google Privacy Policy and Terms of Service apply.

article thumbnail

Predicting Employee Attrition using Orange(.ows) Visual Programming Software

Analytics Vidhya

This article was published as a part of the Data Science Blogathon. Introduction If you want to know – How to use MACHINE LEARNING. ows) Visual Programming Software appeared first on Analytics Vidhya. The post Predicting Employee Attrition using Orange(.ows)

article thumbnail

Geospatial visualization via Folium Library

Analytics Vidhya

ArticleVideo Book This article was published as a part of the Data Science Blogathon Overview Nowadays, there are multiple data science projects requiring the use. The post Geospatial visualization via Folium Library appeared first on Analytics Vidhya.

article thumbnail

Visualizing PCA in R-Programming with Factoshiny

Analytics Vidhya

ArticleVideos This article was published as a part of the Data Science Blogathon. Introduction Transforming a data set with Principal Component Analysis (PCA) is. The post Visualizing PCA in R-Programming with Factoshiny appeared first on Analytics Vidhya.

article thumbnail

Creating Linear Model, It’s Equation and Visualization for Analysis

Analytics Vidhya

This article was published as a part of the Data Science Blogathon. Introduction Have you ever been tasked with visualizing the relationship between each. The post Creating Linear Model, It’s Equation and Visualization for Analysis appeared first on Analytics Vidhya.

article thumbnail

Everything You Need to Know about LIME

Analytics Vidhya

This article was published as a part of the Data Science Blogathon. Why does a Machine Learning Model need to be interpretable? In this article, I will walk you through one technique that makes any machine learning model interpretable. The […].