article thumbnail

Remove Your Rose Tinted Glasses: Data Visualizations Designed to Mislead

datapine

1) Misleading Data Visualization Examples. 2) How to Avoid Misleading Visuals. 3) The Impact Of Bad Data Visualizations. But while that may be the case, people are duped by data visualizations every day. Bad data visualizations come in many forms, with some more obvious than others. Table of Contents.

article thumbnail

Take Advantage Of Operational Metrics & KPI Examples – A Comprehensive Guide

datapine

By establishing clear operational metrics and evaluate performance, companies have the advantage of using what is crucial to stay competitive in the market, and that’s data. Your Chance: Want to visualize & track operational metrics with ease? What Are Metrics And Why Are They Important?

KPI 269
Insiders

Sign Up for our Newsletter

This site is protected by reCAPTCHA and the Google Privacy Policy and Terms of Service apply.

article thumbnail

A Beginner’s Guide To Inventory Metrics And Best Practices

datapine

At the same time, inventory metrics are needed to help managers and professionals in reaching established goals, optimizing processes, and increasing business value. Collecting big amounts of data is not the only thing to do; knowing how to process, analyze, and visualize the insights you gain from it is key.

Metrics 286
article thumbnail

Customer Retention Dashboard & Metrics Examples For Modern Companies

datapine

A customer retention dashboard and metrics depicted in a neat visual will help you in monitoring, analyzing, and managing multiple customer-centric points and how they echo in your business. A professional dashboard maker can help in the process, but let’s see this through some visual examples of customer retention.

article thumbnail

The Ultimate Guide to Modern Data Quality Management (DQM) For An Effective Data Quality Control Driven by The Right Metrics

datapine

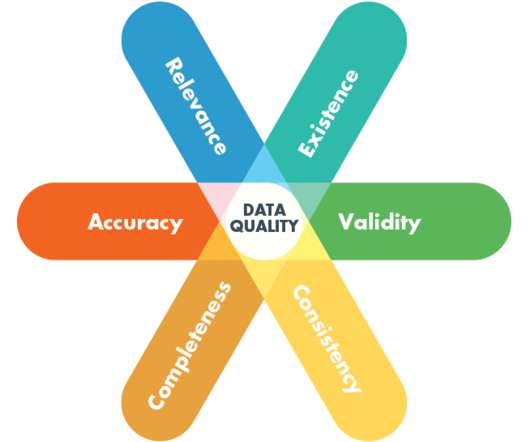
6) Data Quality Metrics Examples. In this article, we will detail everything which is at stake when we talk about DQM: why it is essential, how to measure data quality, the pillars of good quality management, and some data quality control techniques. We will go over them in the third part of this article. Table of Contents.

article thumbnail

What Data Metrics Should Be Incorporated Into a Marketing Dashboard?

Smart Data Collective

Visual marketing dashboards are prime examples of using big data effectively in marketing. In this day and age, all businesses must pay especially close consideration to the performance of their marketing metrics dashboard. In this article, we will discuss what l needs to be included in marketing reporting dashboards.

article thumbnail

Take Complete Charge Of Customer Satisfaction Metrics – Customer Effort Score, NPS & Customer Satisfaction Score

datapine

Read here how these metrics can drive your customers’ satisfaction up! Customer satisfaction metrics evaluate how the products or services supplied by a company meet or surpass a customer’s expectations. You can use different scales to measure the experience or emojis (visual representation of satisfactory levels).

Metrics 134