article thumbnail

PASS Financials: past, present and the Future:

Jen Stirrup

I went through four years of personal hell as a PASS Board member, taking s**t from people who just did not believe that business analysis, business analytics or similar related technologies such as Power BI had any place at the PASS table. I have visualized the data below so you can see it below.

Metrics 104
article thumbnail

Establishing Rapport With Critical Stakeholders

BA Learnings

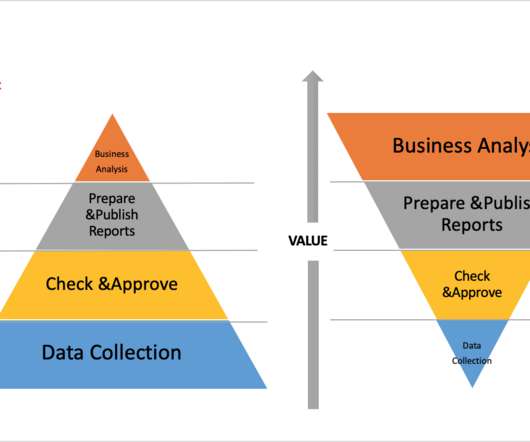
Why establishing a good rapport is essential In the course of business analysis work, stakeholders of all kinds get caught in the fray. They have to balance their duties with contributing valuable insights to your project, and it’s your job as a business analyst to make this easier. Customers ? Employees ?

Insiders

Sign Up for our Newsletter

This site is protected by reCAPTCHA and the Google Privacy Policy and Terms of Service apply.

article thumbnail

Financial Dashboard: Definition, Examples, and How-tos

FineReport

A financial dashboard, one of the most important types of data dashboards , functions as a business intelligence tool that enables finance and accounting teams to visually represent, monitor, and present financial key performance indicators (KPIs). You can download FineReport for free and have a try!

article thumbnail

Financial Statements: Types, Examples, and Analysis

FineReport

” The income statement presents the enterprise’s operating results during a defined accounting period. How are the Three Financial Statements Presented? Additionally, it is essential to present comparative data for receivable bills, collected bills, and collection rates for each branch.

article thumbnail

Business Dashboard: Door To Acute Business Insights

FineReport

Business dashboard: definition & benefits. What is a business dashboard? Business dashboards dig information from data and present an easily digestible view of business performance to help strategic and decision-making. One of the vital reasons people resort to business dashboard is the visualization of data.

article thumbnail

Reporting Tool Beyond Excel: Dynamic and Automatic

FineReport

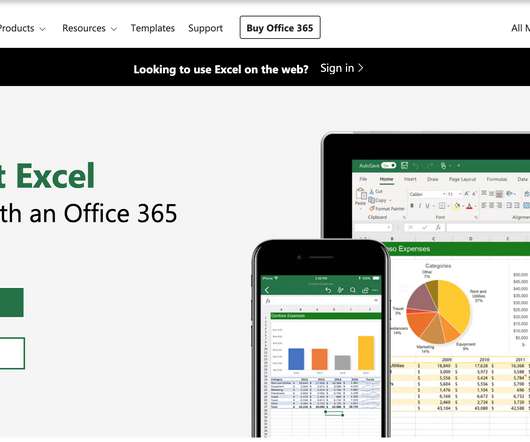
There are relatively few types of charts for data visualization in Excel. At present, the common needs in the field of big data are not in the optional range. Decision reports are also called dashboards , which are data visualization reports stitched together by various charts. The available themes are also Microsoft classics.

article thumbnail

Your Data Won’t Speak Unless You Ask It The Right Data Analysis Questions

datapine

5) Which statistical analysis techniques do you want to apply? There are dozens of statistical analysis techniques that you can use. The visual reports you provide them with should be easy-to-use and actionable. 8) What data visualizations should you choose? Effective presentation aids in all of these areas.

IT 317