article thumbnail

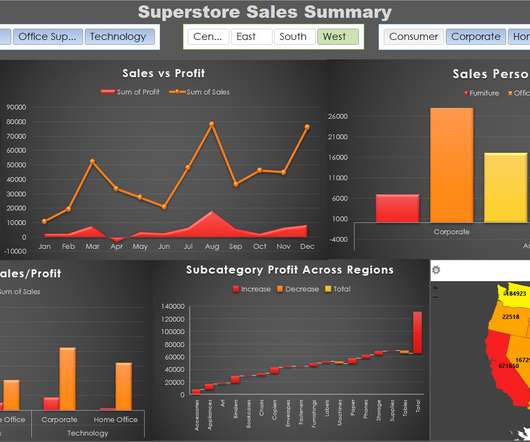
Walmart’s Sales Analysis through Data Visualization

Analytics Vidhya

This article was published as a part of the Data Science Blogathon. Overview In this article, we will be dealing with Walmart’s sales dataset and will follow all the data analysis steps on the same and as a result, will try to get some business-related insights from the operations we will be performing on this dataset. […].

Sales 337
article thumbnail

DataOps For Business Analytics Teams

DataKitchen

Business analysts must rapidly deliver value and simultaneously manage fragile and error-prone analytics production pipelines. Data tables from IT and other data sources require a large amount of repetitive, manual work to be used in analytics. In business analytics, fire-fighting and stress are common.

Insiders

Sign Up for our Newsletter

This site is protected by reCAPTCHA and the Google Privacy Policy and Terms of Service apply.

Trending Sources

article thumbnail

30 Best Data Science Books to Read in 2023

Analytics Vidhya

Introduction Data science has taken over all economic sectors in recent times. To achieve maximum efficiency, every company strives to use various data at every stage of its operations.

article thumbnail

Getting Started with Data Analysis using Power BI

Analytics Vidhya

This article was published as a part of the Data Science Blogathon. Microsoft‘s business analytics product, Power BI, delivers interactive data visualization BI capabilities that allow users to see and share data and insights throughout their organisation. What is Power BI?

article thumbnail

Data science vs data analytics: Unpacking the differences

IBM Big Data Hub

Though you may encounter the terms “data science” and “data analytics” being used interchangeably in conversations or online, they refer to two distinctly different concepts. Meanwhile, data analytics is the act of examining datasets to extract value and find answers to specific questions.

article thumbnail

Creating Interactive and Animated Charts with ipyvizzu

Analytics Vidhya

Introduction Data visualization (DV) plays a crucial role in analyzing and interpreting data. With the growing importance of data science and machine learning, data analysis holds a special place in […] The post Creating Interactive and Animated Charts with ipyvizzu appeared first on Analytics Vidhya.

article thumbnail

Top Data Science Tools That Will Empower Your Data Exploration Processes

datapine

Data science has become an extremely rewarding career choice for people interested in extracting, manipulating, and generating insights out of large volumes of data. To fully leverage the power of data science, scientists often need to obtain skills in databases, statistical programming tools, and data visualizations.