Remove Business Intelligence Remove Dashboards Remove Metrics Remove Optimization
article thumbnail

Your Introduction To CFO Dashboards & Reports In The Digital Age

datapine

CFO dashboards exist to enhance the strategic as well as the analytical efforts related to every financial aspect of your business. Here, we’ll explore the dynamics of reports for CFOs, look at CFO reporting tools, and consider real-world examples of both CFO dashboards and reports. What Is A CFO Dashboard?

article thumbnail

A Beginner’s Guide To Inventory Metrics And Best Practices

datapine

In our cutthroat digital economy, massive amounts of data are gathered, stored, analyzed, and optimized to deliver the best possible experience to customers and partners. At the same time, inventory metrics are needed to help managers and professionals in reaching established goals, optimizing processes, and increasing business value.

Metrics 286
Insiders

Sign Up for our Newsletter

This site is protected by reCAPTCHA and the Google Privacy Policy and Terms of Service apply.

article thumbnail

Your Guide To Modern Agency Analytics, Dashboards & Reporting Techniques

datapine

The answer is modern agency analytics reports and interactive dashboards. Starting with its definition, following with the benefits of agency reports, a list of tools, and a set of agency dashboard examples. Agencies benefit from interactive dashboard tools to prove the success of their strategies and campaigns to clients.

article thumbnail

Take Advantage Of Operational Metrics & KPI Examples – A Comprehensive Guide

datapine

Identifying what is working and what is not is one of the invaluable management practices that can decrease costs, determine the progress a business is making, and compare it to organizational goals. Your Chance: Want to visualize & track operational metrics with ease? What Are Metrics And Why Are They Important?
KPI 269
article thumbnail

The Power Of Real Time Analytics & Business Intelligence Explained

datapine

But, while data offers us invaluable insight in more ways than one, with so much to analyze and such little time, it’s becoming increasingly difficult to understand which metrics offer real value. As such, we have to find approaches to data analytics and business intelligence. What Is Real Time Business Intelligence?

article thumbnail

Enhance monitoring and debugging for AWS Glue jobs using new job observability metrics, Part 3: Visualization and trend analysis using Amazon QuickSight

AWS Big Data

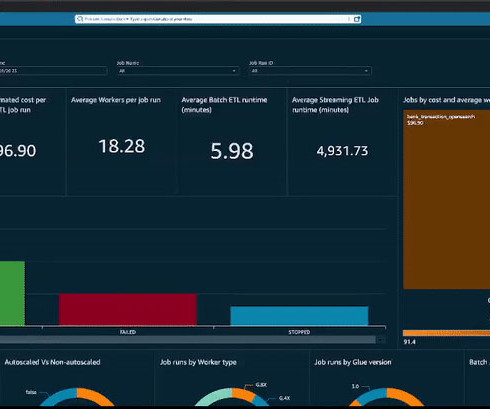
In Part 2 of this series, we discussed how to enable AWS Glue job observability metrics and integrate them with Grafana for real-time monitoring. Grafana provides powerful customizable dashboards to view pipeline health. QuickSight makes it straightforward for business users to visualize data in interactive dashboards and reports.

Metrics 110
article thumbnail

Business Intelligence for Fairs, Congresses and Exhibitions

Smart Data Collective

While different companies, regardless of their size, have different operational processes, they share a common need for actionable insight to drive success in their business. Advancement in big data technology has made the world of business even more competitive. This eliminates guesswork when coming up with business strategies.