article thumbnail

How to Design Better Dashboards: a Visual Guide

Sisense

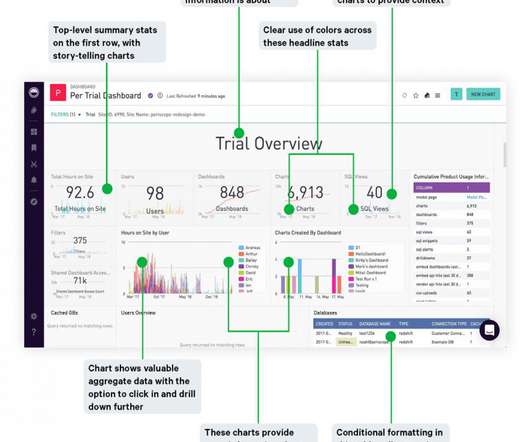
Everyone wants to get more out of their data, but how exactly to do that can leave you scratching your head. Better dashboards, better decisions. A well-constructed and organized dashboard empowers users to make better data-driven decisions. The two dashboards below were created from the same set of data.

article thumbnail

BRIDGEi2i launches two interactive dashboards: COVID19 Global Monitor & COVID Stock Market Impact Monitor

bridgei2i

BRIDGEi2i, a leading AI consultancy, has launched two interactive dashboards that highlight the impact of COVID19 globally across businesses and communities. The Global COVID-19 Monitor gives live insights on the spread of the pandemic across the world and allows you to slice and dice data from many perspectives. www.BRIDGEi2i.com.

Insiders

Sign Up for our Newsletter

This site is protected by reCAPTCHA and the Google Privacy Policy and Terms of Service apply.

article thumbnail

5 surefire ways to derail a digital transformation (without knowing it)

CIO Business Intelligence

But are product managers developing market- and customer-driven roadmaps and prioritized backlogs? Digital transformations derail when CIOs miss the opportunity to establish and communicate product management responsibilities for creating and evolving market- and customer-driven roadmaps.

article thumbnail

Cropin’s agriculture industry cloud to provide apps, data frameworks

CIO Business Intelligence

Dubbed Cropin Cloud, the suite comes with the ability to ingest and process data, run machine learning models for quick analysis and decision making, and several applications specific to the industry’s needs. The suite, according to the company, consists of three layers: Cropin Apps, the Cropin Data Hub and Cropin Intelligence.

B2B 86
article thumbnail

Five benefits of a data catalog

IBM Big Data Hub

An enterprise data catalog does all that a library inventory system does – namely streamlining data discovery and access across data sources – and a lot more. For example, data catalogs have evolved to deliver governance capabilities like managing data quality and data privacy and compliance.

article thumbnail

BRIDGEi2i Newsletter: May 2020 Recap

bridgei2i

Our first series “AI for Digital Enterprise” combines the role of AI and data science with various facets of the Digital Transformation journey. BRIDGEi2i was honored with its second Honorable Mention in Gartner’s 2020 Magic Quadrant for Data and Analytics Service Providers, Worldwide. COVID Visualization Dashboards.

article thumbnail

Digital Dashboards: Strategic & Tactical: Best Practices, Tips, Examples

Occam's Razor

I'm excited about the power of a well created dashboard. Dashboards are every where, we will look at a lot of them in this post and they are all digital. Here's a great dashboard, for the Museum of Art… take a minute to ponder it… Isn't it pretty awesome? They are data pukes. Still a data puke.