Remove Cost-Benefit Remove Dashboards Remove Metrics Remove Visualization
article thumbnail

Top 15 Warehouse KPIs & Metrics For Efficient Management 

datapine

3) Top 15 Warehouse KPIs Examples 4) Warehouse KPI Dashboard Template The use of big data and analytics technologies has become increasingly popular across industries. Keep on reading to learn a definition, benefits, and a warehouse KPI list with the most prominent examples any manager should be tracking to achieve operational success.

Metrics 217
article thumbnail

How Recruitment Metrics & Dashboards Can Help Improve Hiring New Candidates

datapine

That’s where recruitment metrics come in. By utilizing recruiting KPIs presented through the medium of visual and interactive HR dashboards , it’s possible to use recruitment metrics to better interpret and evaluate a variety of talent acquisition factors that aid in hiring processes. And why should you care?

Metrics 210
Insiders

Sign Up for our Newsletter

This site is protected by reCAPTCHA and the Google Privacy Policy and Terms of Service apply.

Trending Sources

article thumbnail

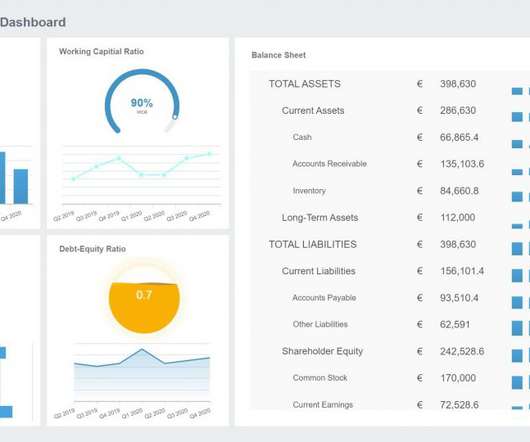
Your Introduction To CFO Dashboards & Reports In The Digital Age

datapine

CFO dashboards exist to enhance the strategic as well as the analytical efforts related to every financial aspect of your business. Here, we’ll explore the dynamics of reports for CFOs, look at CFO reporting tools, and consider real-world examples of both CFO dashboards and reports. Benefit from great CFO dashboards & reports!

article thumbnail

Your Guide To Modern Agency Analytics, Dashboards & Reporting Techniques

datapine

The answer is modern agency analytics reports and interactive dashboards. Starting with its definition, following with the benefits of agency reports, a list of tools, and a set of agency dashboard examples. Explore our 14 days free trial & benefit from interactive agency reports! Benefits Of A Modern Agency Report.

article thumbnail

A Beginner’s Guide To Inventory Metrics And Best Practices

datapine

At the same time, inventory metrics are needed to help managers and professionals in reaching established goals, optimizing processes, and increasing business value. Collecting big amounts of data is not the only thing to do; knowing how to process, analyze, and visualize the insights you gain from it is key.

Metrics 286
article thumbnail

Take Advantage Of Operational Metrics & KPI Examples – A Comprehensive Guide

datapine

Identifying what is working and what is not is one of the invaluable management practices that can decrease costs, determine the progress a business is making, and compare it to organizational goals. Your Chance: Want to visualize & track operational metrics with ease? What Are Metrics And Why Are They Important?

KPI 269
article thumbnail

Remove Your Rose Tinted Glasses: Data Visualizations Designed to Mislead

datapine

1) Misleading Data Visualization Examples. 2) How to Avoid Misleading Visuals. 3) The Impact Of Bad Data Visualizations. But while that may be the case, people are duped by data visualizations every day. Bad data visualizations come in many forms, with some more obvious than others. Table of Contents.