Remove Dashboards Remove Data Collection Remove Document Remove Visualization
article thumbnail

Master Data Visualization Techniques: A Comprehensive Guide

FineReport

Data visualization techniques are paramount in today’s data-driven world. Mastering data visualization techniques is not just a skill but a necessity for professionals across various industries. It plays a crucial role in simplifying complex datasets into easily understandable visuals.

article thumbnail

Everything You Need to Know About Project Management Dashboard

FineReport

Thus, one tool that has gained significant popularity in recent years is the Project Management Dashboard. Moreover, the implementation of an effective Project Management Dashboard facilitates data-driven decision-making and sustainable business success. What Is A Project Management Dashboard?

Insiders

Sign Up for our Newsletter

This site is protected by reCAPTCHA and the Google Privacy Policy and Terms of Service apply.

Trending Sources

article thumbnail

A Guide To The Methods, Benefits & Problems of The Interpretation of Data

datapine

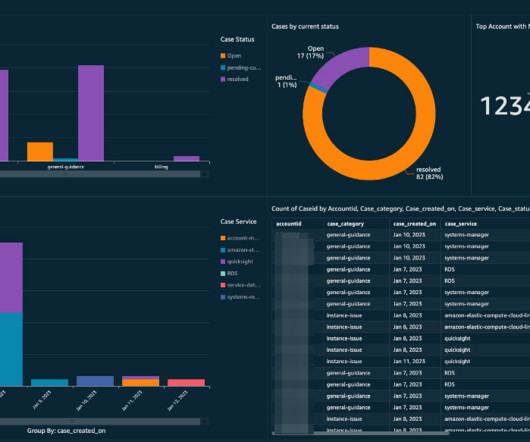
2) How To Interpret Data? 3) Why Data Interpretation Is Important? 4) Data Analysis & Interpretation Problems. 5) Data Interpretation Techniques & Methods. 6) The Use of Dashboards For Data Interpretation. Business dashboards are the digital age tools for big data.

article thumbnail

Designing Visual Appendices for Your Next Report—In Under an Hour

Depict Data Studio

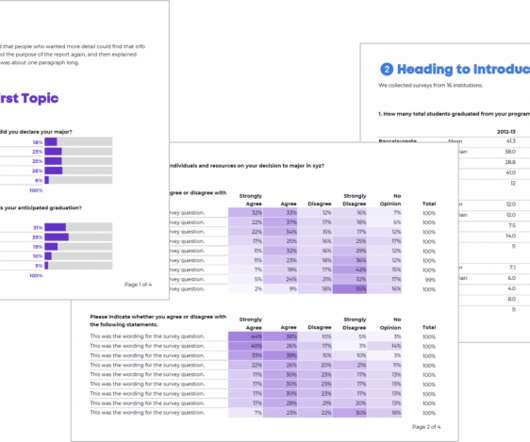
tables and tables of closed-ended and open-ended survey data) Data collection instruments (e.g., our report’s main body could focus on this year’s data , but we might include tables that compare this year’s data to last year’s data in the appendix). Introducing… Visual Appendices! Third, add visuals!

article thumbnail

A history of tech adaptation for today’s changing business needs

CIO Business Intelligence

The first was becoming one of the first research companies to move its panels and surveys online, reducing costs and increasing the speed and scope of data collection. Additionally, it continuously explores reams of data and modern tools to improve its capabilities and adapt to the changing data landscape.

article thumbnail

A Beginner’s Guide to Financial Report: Definition, Types, Tools & Templates

FineReport

Financial reports (also known as financial statements ) are formal documents used to comprehensively and accurately record and reflect an enterprise’s financial conditions, operating results, and cash flows in a specific period. Step 2: Collect financial data. First, you need to collect and organize the original receipts.

article thumbnail

What is Web Report? Top Web Reporting Tool You Can’t-Miss

FineReport

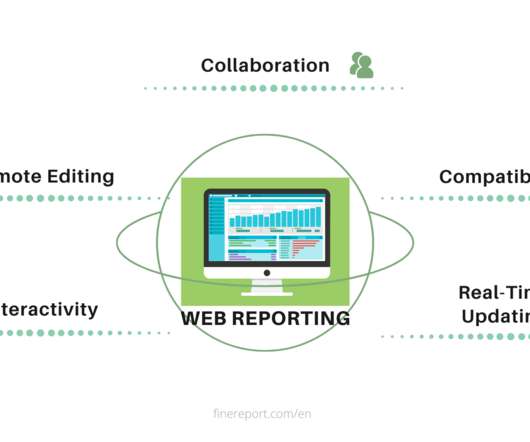
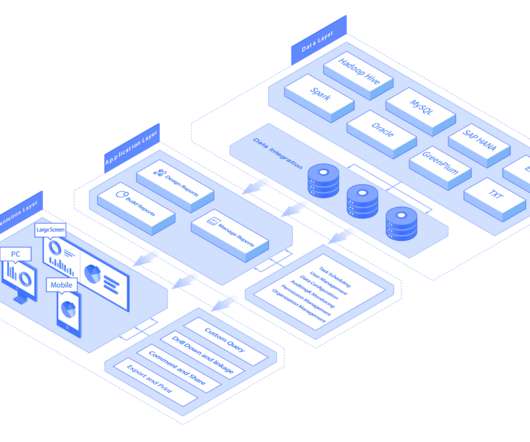
Web Dashboard (by FineReport). What’s more impressive is that once you create a template in FineReport Designer, you can achieve an adaptive display of reports and dashboards, supporting multiple terminals such as PCs, tablets, mobile phones, and large screens. Dashboard Components and Widgets (by FineReport). Conclusion.