Remove Dashboards Remove Data Integration Remove Data Warehouse Remove Metrics
article thumbnail

Enhance monitoring and debugging for AWS Glue jobs using new job observability metrics: Part 2

AWS Big Data

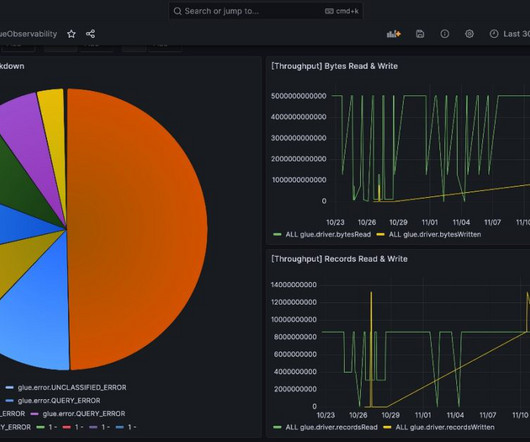
AWS Glue has made this more straightforward with the launch of AWS Glue job observability metrics , which provide valuable insights into your data integration pipelines built on AWS Glue. This post, walks through how to integrate AWS Glue job observability metrics with Grafana using Amazon Managed Grafana.

Metrics 100
article thumbnail

Explore The Power & Potential Of Professional Social Media Dashboards

datapine

Gathering data and information from one or multiple platforms and creating a comprehensive social media dashboard is equally important as creating the social content itself. Your Chance: Want to test a social media dashboard software for free? Benefit from professional social dashboards! What Is A Social Media Dashboard?

Insiders

Sign Up for our Newsletter

This site is protected by reCAPTCHA and the Google Privacy Policy and Terms of Service apply.

Trending Sources

article thumbnail

Enhance monitoring and debugging for AWS Glue jobs using new job observability metrics, Part 3: Visualization and trend analysis using Amazon QuickSight

AWS Big Data

In Part 2 of this series, we discussed how to enable AWS Glue job observability metrics and integrate them with Grafana for real-time monitoring. Grafana provides powerful customizable dashboards to view pipeline health. QuickSight lets you perform aggregate calculations on metrics for deeper analysis.

Metrics 107
article thumbnail

Mastering BI Dashboard Tools: Your Essential Guide

FineReport

In today’s data-driven landscape, businesses are leaning more on BI tools , particularly BI dashboard solutions, to enhance decision-making through data visualization. These BI Dashboard tools blend advanced analytics with user-friendly interfaces, revealing invaluable insights.

article thumbnail

Enhance monitoring and debugging for AWS Glue jobs using new job observability metrics

AWS Big Data

For any modern data-driven company, having smooth data integration pipelines is crucial. These pipelines pull data from various sources, transform it, and load it into destination systems for analytics and reporting. This post demonstrates how the new enhanced metrics help you monitor and debug AWS Glue jobs.

Metrics 97
article thumbnail

Financial Dashboard: Definition, Examples, and How-tos

FineReport

In today’s dynamic business environment, gaining comprehensive visibility into financial data is crucial for making informed decisions. This is where the significance of a financial dashboard shines through. What is A Financial Dashboard? You can download FineReport for free and have a try!

article thumbnail

Bridging the Gap: How ‘Data in Place’ and ‘Data in Use’ Define Complete Data Observability

DataKitchen

Data in Place refers to the organized structuring and storage of data within a specific storage medium, be it a database, bucket store, files, or other storage platforms. In the contemporary data landscape, data teams commonly utilize data warehouses or lakes to arrange their data into L1, L2, and L3 layers.

Testing 169