Remove Dashboards Remove Data Integration Remove Data Warehouse Remove Optimization
article thumbnail

Mastering BI Dashboard Tools: Your Essential Guide

FineReport

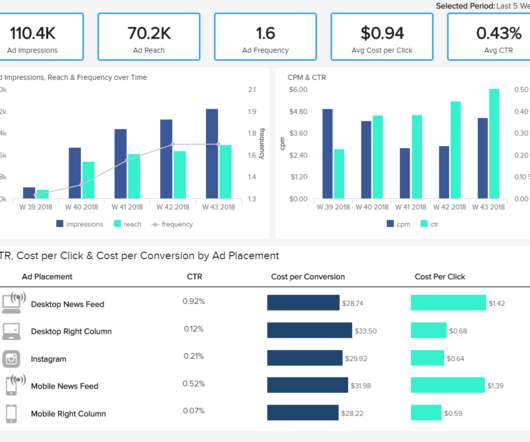
In today’s data-driven landscape, businesses are leaning more on BI tools , particularly BI dashboard solutions, to enhance decision-making through data visualization. These BI Dashboard tools blend advanced analytics with user-friendly interfaces, revealing invaluable insights.

article thumbnail

Financial Dashboard: Definition, Examples, and How-tos

FineReport

In today’s dynamic business environment, gaining comprehensive visibility into financial data is crucial for making informed decisions. This is where the significance of a financial dashboard shines through. What is A Financial Dashboard?

Insiders

Sign Up for our Newsletter

This site is protected by reCAPTCHA and the Google Privacy Policy and Terms of Service apply.

Trending Sources

article thumbnail

Announcing zero-ETL integrations with AWS Databases and Amazon Redshift

AWS Big Data

As customers become more data driven and use data as a source of competitive advantage, they want to easily run analytics on their data to better understand their core business drivers to grow sales, reduce costs, and optimize their businesses. ETL is the process data engineers use to combine data from different sources.

article thumbnail

Amazon Redshift announcements at AWS re:Invent 2023 to enable analytics on all your data

AWS Big Data

In 2013, Amazon Web Services revolutionized the data warehousing industry by launching Amazon Redshift , the first fully-managed, petabyte-scale, enterprise-grade cloud data warehouse. Amazon Redshift made it simple and cost-effective to efficiently analyze large volumes of data using existing business intelligence tools.

article thumbnail

How AWS helped Altron Group accelerate their vision for optimized customer engagement

AWS Big Data

In particular, they wanted to enable their account managers, sales executives, and analysts to use actual data and facts to get a 360 view of their accounts. Target – Dashboards to be refreshed on a daily basis that would provide insights on sales, gross profit, sales pipelines, and customers.

article thumbnail

How GamesKraft uses Amazon Redshift data sharing to support growing analytics workloads

AWS Big Data

Amazon Redshift is a fully managed data warehousing service that offers both provisioned and serverless options, making it more efficient to run and scale analytics without having to manage your data warehouse. These upstream data sources constitute the data producer components.

article thumbnail

Enhance monitoring and debugging for AWS Glue jobs using new job observability metrics: Part 2

AWS Big Data

AWS Glue has made this more straightforward with the launch of AWS Glue job observability metrics , which provide valuable insights into your data integration pipelines built on AWS Glue. With Grafana, you can create, explore, and share visually rich, data-driven dashboards. Lastly, configure the dashboard.

Metrics 97