Remove Dashboards Remove Data Integration Remove Data Warehouse Remove Software
article thumbnail

Financial Dashboard: Definition, Examples, and How-tos

FineReport

In today’s dynamic business environment, gaining comprehensive visibility into financial data is crucial for making informed decisions. This is where the significance of a financial dashboard shines through. What is A Financial Dashboard? You can download FineReport for free and have a try!

article thumbnail

Enhance monitoring and debugging for AWS Glue jobs using new job observability metrics, Part 3: Visualization and trend analysis using Amazon QuickSight

AWS Big Data

In Part 2 of this series, we discussed how to enable AWS Glue job observability metrics and integrate them with Grafana for real-time monitoring. Grafana provides powerful customizable dashboards to view pipeline health. QuickSight makes it straightforward for business users to visualize data in interactive dashboards and reports.

Metrics 102
Insiders

Sign Up for our Newsletter

This site is protected by reCAPTCHA and the Google Privacy Policy and Terms of Service apply.

article thumbnail

Enhance monitoring and debugging for AWS Glue jobs using new job observability metrics

AWS Big Data

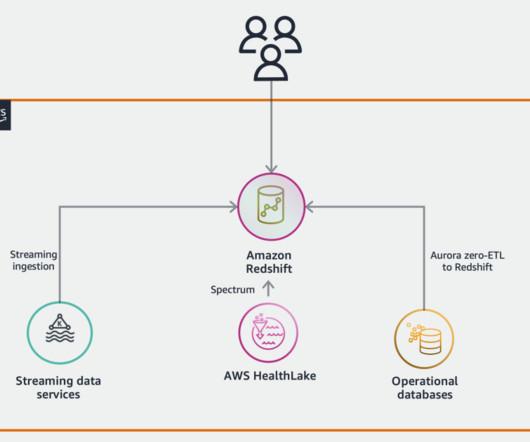
For any modern data-driven company, having smooth data integration pipelines is crucial. These pipelines pull data from various sources, transform it, and load it into destination systems for analytics and reporting. About the Authors Noritaka Sekiyama is a Principal Big Data Architect on the AWS Glue team.

Metrics 93
article thumbnail

Reporting System: Everything You Need to Know

FineReport

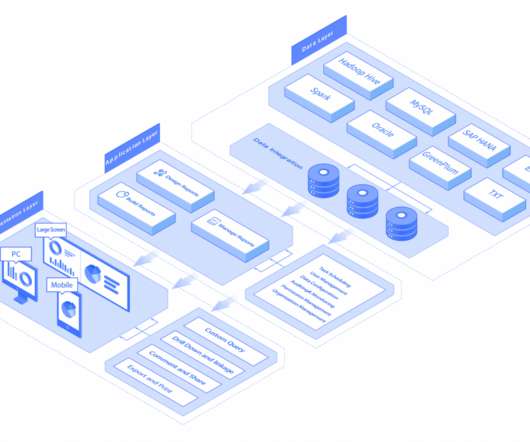
With the development of enterprise informatization, there are more and more kinds of data produced, and the demand for reports surges day by day. Let’s discover how to choose a great reporting software and design the architecture to efficiently build a reporting system. Software to Build Reporting System. Reports Portal?

article thumbnail

The 6-Step Guide to Integrating Business Intelligence and Analytics

Smart Data Collective

Because employees of many different departments will be involved in managing the data in business intelligence, everyone needs to be on the same page before moving forward. Set Up Data Integration. This stage is where the data gets turned into usable information for the end-users. Choose Tools and Create a Team.

article thumbnail

Understanding Data Entities in Microsoft Dynamics 365

Jet Global

For anyone that needs to develop custom reports and dashboards, it all begins with understanding data entities. What Are Data Entities? Confusing matters further, Microsoft has also created something called the Data Entity Store, which serves a different purpose and functions independently of data entities.

article thumbnail

Enterprise Reporting: The 2020’s Comprehensive Guide

FineReport

Therefore, business intelligence is a broader category that includes data processing, perform reporting, analytics, and visualization functions. Also, the features of an enterprise reporting tool can be associated with business intelligence (BI) software suite. Because FineReport supports multiple data sources and data integration.