Remove Dashboards Remove Data Integration Remove Data Warehouse Remove Visualization
article thumbnail

Enhance monitoring and debugging for AWS Glue jobs using new job observability metrics, Part 3: Visualization and trend analysis using Amazon QuickSight

AWS Big Data

Grafana provides powerful customizable dashboards to view pipeline health. QuickSight makes it straightforward for business users to visualize data in interactive dashboards and reports. QuickSight makes it straightforward for business users to visualize data in interactive dashboards and reports.

Metrics 108
article thumbnail

Financial Dashboard: Definition, Examples, and How-tos

FineReport

In today’s dynamic business environment, gaining comprehensive visibility into financial data is crucial for making informed decisions. This is where the significance of a financial dashboard shines through. What is A Financial Dashboard? You can download FineReport for free and have a try! Free Download of FineReport 1.

Insiders

Sign Up for our Newsletter

This site is protected by reCAPTCHA and the Google Privacy Policy and Terms of Service apply.

Trending Sources

article thumbnail

Accelerate analytics on Amazon OpenSearch Service with AWS Glue through its native connector

AWS Big Data

As the volume and complexity of analytics workloads continue to grow, customers are looking for more efficient and cost-effective ways to ingest and analyse data. OpenSearch Service is used for multiple purposes, such as observability, search analytics, consolidation, cost savings, compliance, and integration.

article thumbnail

Feeding America turns to data to feed the hungry

CIO Business Intelligence

Central to Byrdak’s multi-year transformation plan is the expansion of MealConnect, the first nationally available food rescue and sourcing platform, and a new data warehouse to anchor an analytics offering that helps food banks analyze and visualize their food sourcing and distribution data.

article thumbnail

Enhance monitoring and debugging for AWS Glue jobs using new job observability metrics

AWS Big Data

For any modern data-driven company, having smooth data integration pipelines is crucial. These pipelines pull data from various sources, transform it, and load it into destination systems for analytics and reporting. The following is a visual representation of an example job where the number of workers is 10.

Metrics 98
article thumbnail

Breaking down Business Intelligence

BizAcuity

So, make sure you have a data strategy in place. Data Integration. The easiest way to tap into data is integrating all your data to get a detailed understanding of your operations and your customers. Data mining. Data mining allows refining and analyzing of the data on a near-real time basis.

article thumbnail

Reporting System: Everything You Need to Know

FineReport

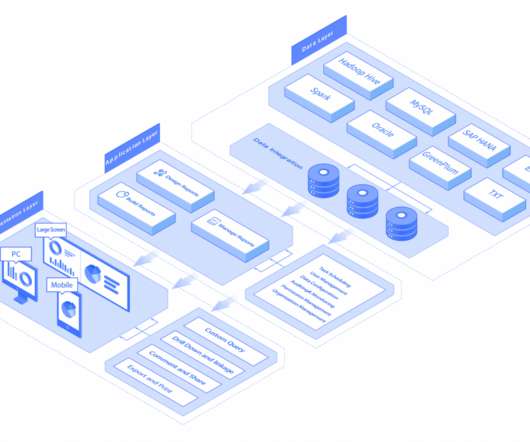
The underlying data is in charge of data management, covering data collection, ETL, building a data warehouse, etc. The data analysis part is responsible for extracting data from the data warehouse, using the query, OLAP, data mining to analyze data, and forming the data conclusion with data visualization.