Remove Dashboards Remove Data Integration Remove Interactive Remove Visualization
article thumbnail

Unveiling the Top 10 Data Visualization Companies of 2024

FineReport

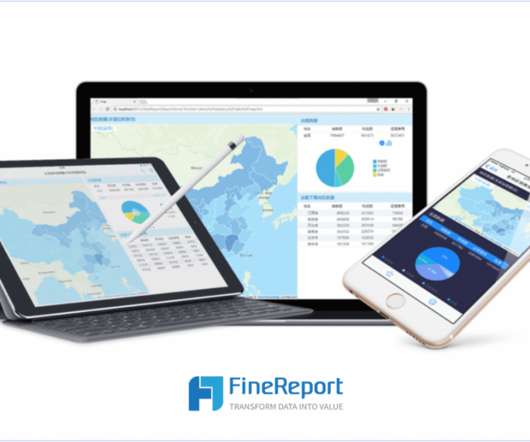
In 2024, data visualization companies play a pivotal role in transforming complex data into captivating narratives. This blog provides an insightful exploration of the leading entities shaping the data visualization landscape. Market Impact The impact a company has on the market speaks volumes about its success.

article thumbnail

Master Data Visualization Techniques: A Comprehensive Guide

FineReport

Data visualization techniques are paramount in today’s data-driven world. Mastering data visualization techniques is not just a skill but a necessity for professionals across various industries. It plays a crucial role in simplifying complex datasets into easily understandable visuals.

Insiders

Sign Up for our Newsletter

This site is protected by reCAPTCHA and the Google Privacy Policy and Terms of Service apply.

article thumbnail

Enhance monitoring and debugging for AWS Glue jobs using new job observability metrics, Part 3: Visualization and trend analysis using Amazon QuickSight

AWS Big Data

Grafana provides powerful customizable dashboards to view pipeline health. QuickSight makes it straightforward for business users to visualize data in interactive dashboards and reports. QuickSight makes it straightforward for business users to visualize data in interactive dashboards and reports.

Metrics 104
article thumbnail

What is IoT Dashboard?

FineReport

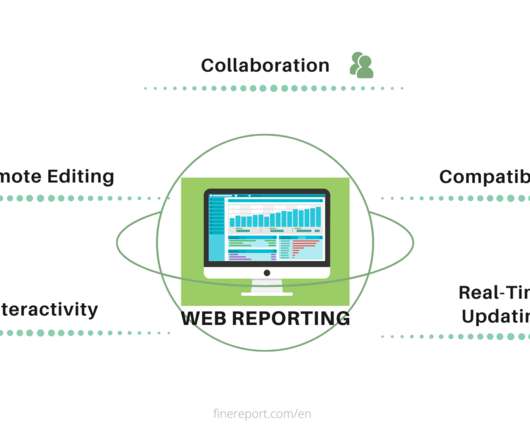
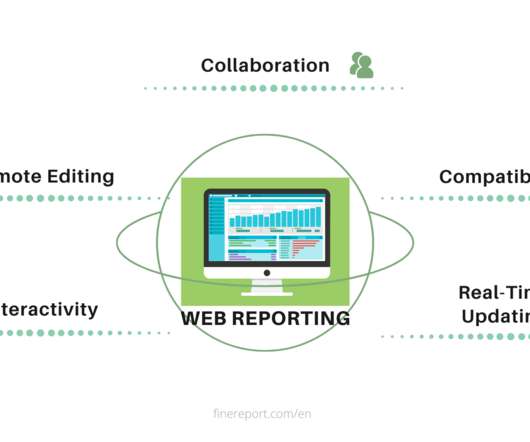
The Internet of Things (IoT) has revolutionized the way we interact with devices and gather data. Among the tools that have emerged from this digital transformation, IoT dashboards stand out as invaluable assets. IoT dashboards What is IoT Dashboard? You can download FineReport for free and have a try!

IoT 52
article thumbnail

Checklist of Data Dashboard for 2021? Definition, Examples & More

FineReport

Now here comes data dashboard ?Similar Similar to the instrument panel equipped in a car, it transforms obscure expertise into plain visualizations which are pleasing to both the eye and mind. What is Data Dashboard?–Definition. Data Dashboard Tool. Why Data Dashboard?

article thumbnail

Mastering Data Visualization Jobs: Your Step-by-Step Career Guide

FineReport

Discovering the World of Data Visualization Jobs In today’s data-driven world, data visualization jobs play a crucial role in transforming complex information into visually appealing and easy-to-understand graphics. But what exactly are data visualization jobs, and why are they important?

article thumbnail

How To Interact With Power BI Data In A PowerPoint Presentation

Smart Data Collective

Power BI proves to be the best tool for analysis and visualization of data. Microsoft Power BI is a Business Intelligence and Data Visualization tool which assists organizations to analyze data from multiple sources, convert it into an interactive dashboard and share insights.