Remove Dashboards Remove Data Integration Remove Publishing Remove Reporting
article thumbnail

Enhance monitoring and debugging for AWS Glue jobs using new job observability metrics, Part 3: Visualization and trend analysis using Amazon QuickSight

AWS Big Data

In Part 2 of this series, we discussed how to enable AWS Glue job observability metrics and integrate them with Grafana for real-time monitoring. Grafana provides powerful customizable dashboards to view pipeline health. QuickSight makes it straightforward for business users to visualize data in interactive dashboards and reports.

Metrics 101
article thumbnail

Reporting System: Everything You Need to Know

FineReport

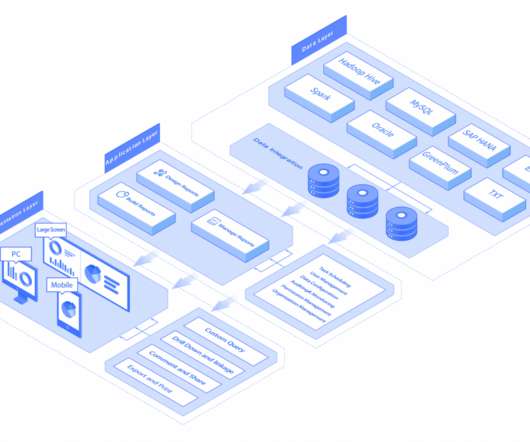
When mentioning the reporting, folders loaded with spreadsheets, graphs, and commentaries may ring a bell. With the development of enterprise informatization, there are more and more kinds of data produced, and the demand for reports surges day by day. What is the Reporting System? Software to Build Reporting System.

Insiders

Sign Up for our Newsletter

This site is protected by reCAPTCHA and the Google Privacy Policy and Terms of Service apply.

article thumbnail

Daily Sales Report: Definition, Samples, Key Elements, and How-tos

FineReport

One of the tools used to achieve this is a daily sales report, which provides an overview of daily sales activities. What is a Daily Sales Report? A daily sales report is a reporting document that provides an overview of a company’s sales performance over a specified period, usually one day.

Sales 52
article thumbnail

Enterprise Reporting: The 2020’s Comprehensive Guide

FineReport

What Is Enterprise Reporting? Enterprise reporting is a process of extracting, processing, organizing, analyzing, and displaying data in the companies. It uses enterprise reporting tools to organize data into charts, tables, widgets, or other visualizations. Common Problems With Enterprise Reporting.

article thumbnail

How To Interact With Power BI Data In A PowerPoint Presentation

Smart Data Collective

Microsoft Power BI is a Business Intelligence and Data Visualization tool which assists organizations to analyze data from multiple sources, convert it into an interactive dashboard and share insights. Data Processing, Data Integration, and Data Presenting form the nucleus of Power BI.

article thumbnail

Case Study – Smarten Business Intelligence Implementation for a Leading Pipes Manufacturer

Smarten

The Smarten team helped the client in establishing a corporate Business Intelligence system rather than merely setting up a Business Intelligence tool for reporting. Exception reporting to monitor sales performance against given target. Exception reporting to monitor sales performance against given target.

article thumbnail

BI Visualization Tools: Top 5 Picks 2021

FineReport

By definition, BI tools always cover the feature of data visualization. BI visualization takes data and converts them into visual charts, graphs, dashboards, and tables. Thus, business analysts can detect hidden patterns, trends, or correlations in data. Dashboard (by FineReport). Top BI Visualization Tools List.