Remove Dashboards Remove Data Processing Remove Testing Remove Visualization
article thumbnail

The Top 20 Data Visualization Books That Should Be On Your Bookshelf

datapine

Now that you’re sold on the power of data analytics in addition to data-driven BI, it’s time to take your journey a step further by exploring how to effectively communicate vital metrics and insights in a concise, inspiring, and accessible format through the power of visualization. That’s a colossal number of books on visualization.

article thumbnail

Apply Modern CRM Dashboards & Reports Into Your Business – Examples & Templates

datapine

With a powerful dashboard maker , each point of your customer relations can be optimized to maximize your performance while bringing various additional benefits to the picture. Finally, we will show you a real-life example so you can get a visual overview and a clearer picture of the points discussed in this article. Let’s begin.

Insiders

Sign Up for our Newsletter

This site is protected by reCAPTCHA and the Google Privacy Policy and Terms of Service apply.

article thumbnail

Move Beyond Excel, PowerPoint And Static Business Reporting with Powerful Interactive Dashboards

datapine

Soon businesses of all sizes will have so much amount of information that dashboard software will be the most invaluable resource a company can have. Visualizing the data and interacting on a single screen is no longer a luxury but a business necessity. That’s why we welcome you to the world of interactive dashboards.

article thumbnail

Take Advantage Of Mobile Dashboards – Examples & Selected Designs

datapine

Mobile technology has changed the way we interact with the world around us, and when it comes to analyzing valuable business insights, mobile dashboards offer the freedom and flexibility to turn stats into success while you’re on the go. What Is A Mobile Dashboard? Why Are Mobile Dashboards Important?

article thumbnail

Monetizing Analytics Features: Why Data Visualizations Will Never Be Enough

Think your customers will pay more for data visualizations in your application? But today, dashboards and visualizations have become table stakes. Five years ago they may have. Discover which features will differentiate your application and maximize the ROI of your embedded analytics. Brought to you by Logi Analytics.

article thumbnail

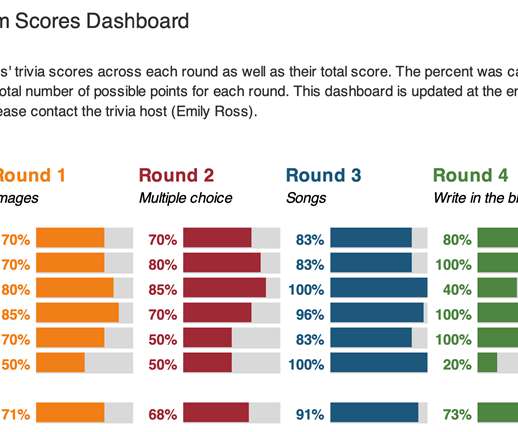
Using Dashboards to Make a Family Trivia Event Even Better

Depict Data Studio

She enrolled in our Dashboard Design course and is sharing how she used her new skills in her personal life. — When COVID-19 pushed many events online, I decided to host a virtual Christmas trivia event for my family. After: My Trivia Night Dashboard. First, I had to decide what type of dashboard I wanted to make.

article thumbnail

The DataOps Vendor Landscape, 2021

DataKitchen

Testing and Data Observability. DataOps needs a directed graph-based workflow that contains all the data access, integration, model and visualization steps in the data analytic production process. It orchestrates complex pipelines, toolchains, and tests across teams, locations, and data centers. Testing and Data Observability.

Testing 300