Remove Dashboards Remove Data Warehouse Remove Visualization Remove Webinar
article thumbnail

Extend Power BI with Custom Visuals

Jet Global

As one of the most widely used data visualization tools in the world, Power BI has made some huge improvements to creating custom visualizations that we want to share with you. When creating or editing a Power BI dashboard, you have access to a ton of different types of visuals. Custom Visuals for Power BI.

article thumbnail

Sisense’s Q2 Release: A Modern Data Experience Across the Analytics Continuum

Sisense

In-Warehouse Data Prep provides builders with the advanced functionality they need to rapidly transform and optimize raw data creating materialized views on cloud data warehouses. In-Warehouse Data Prep supports both AWS Redshift and Snowflake data warehouses. Additional capabilities.

Insiders

Sign Up for our Newsletter

This site is protected by reCAPTCHA and the Google Privacy Policy and Terms of Service apply.

article thumbnail

The top 15 big data and data analytics certifications

CIO Business Intelligence

The certification focuses on the seven domains of the analytics process: business problem framing, analytics problem framing, data, methodology selection, model building, deployment, and lifecycle management. The exam consists of 65 multiple-choice or multiple-response questions, which the candidate has 180 minutes to complete.

Big Data 126
article thumbnail

An A-Z Data Adventure on Cloudera’s Data Platform

Cloudera

A Cloudera Data Warehouse virtual warehouse with Cloudera Data Visualisation enabled exists. A Cloudera Data Engineering service exists. The Data Scientist. Our data adventure starts with Shaun, a Data Scientist at a global bank. The Data Analyst.

article thumbnail

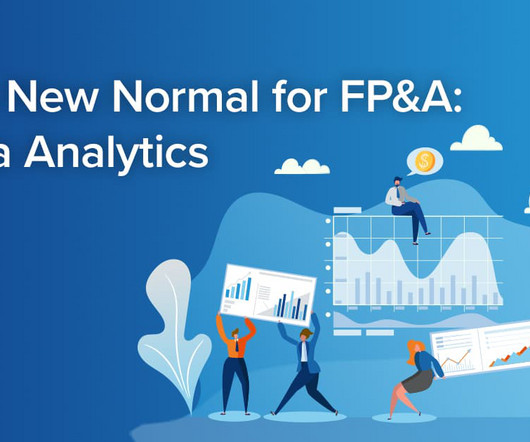
The New Normal for FP&A: Data Analytics

Jedox

In working with clients, these are some of the most common “pain points” I routinely address: Difficulty in extracting data out of legacy systems. Limited real-time analytics and visuals. Inability to get data quickly. Data accuracy concerns. More time spent accessing data vs. making data-driven decisions.

article thumbnail

CDP Data Visualization: Self-Service Data Visualization For The Full Data Lifecycle

Cloudera

Adding to these innovations, we most recently released CDP Data Visualization (DV) — A native visualization tool built from our acquisition of Arcadia Data that augments data exploration and analytics across the lifecycle to more effectively share insights across the business.

article thumbnail

Inside the Mind and Methodology of a Data Scientist

Birst BI

To hear more on Infor Dynamic Science Labs analytic methodologies, watch this on-demand webinar. After a few iterations, this results in a well-defined business question with identifiable supporting data. A foundational data analysis tool is Statistics , and everyone intuitively applies it daily.