article thumbnail

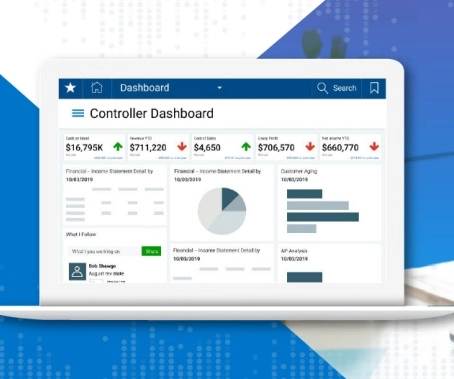
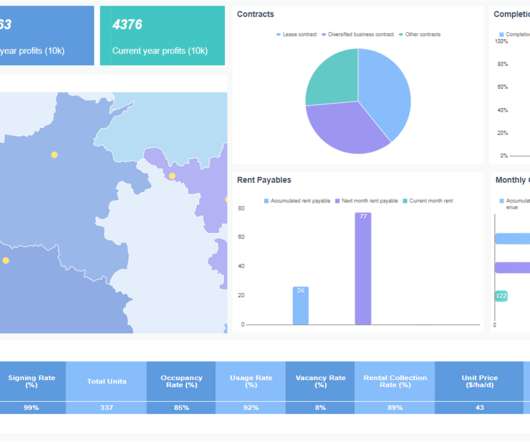
Financial Dashboard: Definition, Examples, and How-tos

FineReport

This is where the significance of a financial dashboard shines through. In this article, we will explore the concept of a financial dashboard, highlight its numerous benefits, and provide various kinds of financial dashboard examples for you to employ and explore. What is A Financial Dashboard?

article thumbnail

Your Guide To Modern Agency Analytics, Dashboards & Reporting Techniques

datapine

The answer is modern agency analytics reports and interactive dashboards. Starting with its definition, following with the benefits of agency reports, a list of tools, and a set of agency dashboard examples. Let’s dig in with the definition of agency analytics. What Are Agency Analytics?

Insiders

Sign Up for our Newsletter

This site is protected by reCAPTCHA and the Google Privacy Policy and Terms of Service apply.

Trending Sources

article thumbnail

Discover Powerful Small Business Dashboards & KPIs To Track For Success

datapine

1) What Is A Small Business Dashboard? 3) Why Do You Need Small Business Dashboards. 4) Small Business Dashboard & KPIs Examples. Enter small business dashboards and metrics. BI dashboard tools provide smaller businesses with valuable insights regarding their operations thanks to real-time access to data.

article thumbnail

Utilize The Effectiveness Of Professional Executive Dashboards & Reports

datapine

By gaining the ability to gather, organize and analyze the metrics that are most important to your organization, you stand to make your business empire more intelligent than ever before – and executive reporting and business dashboards will help you do just that. Exclusive Bonus Content: Executive Dashboards & Reports: A Summary.

article thumbnail

The Definitive Guide to Dashboard Design

Dashboard design can mean the difference between users excitedly embracing your product or ignoring it altogether. Great dashboards lead to richer user experiences and significant return on investment (ROI), while poorly designed dashboards distract users, suppress adoption, and can even tarnish your project or brand.

article thumbnail

Financial Reporting & Financial Analysis: Definitive Guide

FineReport

Dupont Analysis Dashboard. As a classic financial technique, dupont analysis analyzes the enterprise’s financial condition by ROI, which consists of three parts: profit margin, asset turnover, and equity multiplier. . The financial index analysis dashboard opens a window into company’s comprehensive financial standing.

article thumbnail

The Ultimate Guide to Modern Data Quality Management (DQM) For An Effective Data Quality Control Driven by The Right Metrics

datapine

What is the definition of data quality? More generally, low-quality data can impact productivity, bottom line, and overall ROI. No, its ultimate goal is to increase return on investment (ROI) for those business segments that depend upon data. Industry-wide, the positive ROI on quality data is well understood.