Remove Dashboards Remove Document Remove Metrics Remove ROI
article thumbnail

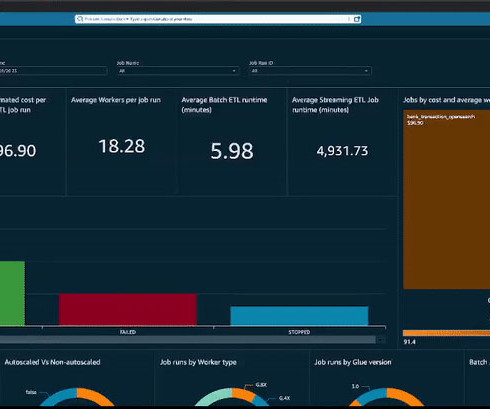
Deploy Amazon QuickSight dashboards to monitor AWS Glue ETL job metrics and set alarms

AWS Big Data

Better visibility can lend itself to gains in operational efficiency, informed business decisions, and further transparency into your return on investment (ROI) when using the various features available through AWS Glue. No matter the industry or level of maturity within AWS, our customers require better visibility into their AWS Glue usage.

Metrics 87
article thumbnail

The Ultimate Guide to Modern Data Quality Management (DQM) For An Effective Data Quality Control Driven by The Right Metrics

datapine

6) Data Quality Metrics Examples. Reporting being part of an effective DQM, we will also go through some data quality metrics examples you can use to assess your efforts in the matter. More generally, low-quality data can impact productivity, bottom line, and overall ROI. Table of Contents. 1) What Is Data Quality Management?

Insiders

Sign Up for our Newsletter

This site is protected by reCAPTCHA and the Google Privacy Policy and Terms of Service apply.

article thumbnail

Move Beyond Excel, PowerPoint And Static Business Reporting with Powerful Interactive Dashboards

datapine

Soon businesses of all sizes will have so much amount of information that dashboard software will be the most invaluable resource a company can have. That’s why we welcome you to the world of interactive dashboards. Your Chance: Want to test interactive dashboard software for free? What Is An Interactive Dashboard?

article thumbnail

5 Best Practices to Boost Your Sales Strategy With Data

datapine

Reports affirm that companies can achieve 40% more ROI by personalizing customer experiences. Short sales cycles thus save time and help companies close more deals, thereby resulting in high ROI and gaining a competitive edge. 4: Track the Crucial Success Metrics. Here are a few vital sales metrics to consider.

Sales 171
article thumbnail

A Guide To The Top 14 Types Of Reports With Examples Of When To Use Them

datapine

In addition, we will see how online dashboards have overthrown the static nature of classic reports and given way to a much faster, more interactive way of working with data. This insightful report displays relevant metrics such as the top-performing agents, net promoter score, and first contact resolution rate, among others.

Reporting 201
article thumbnail

Best 40+ Inventory KPIs and Metric Examples for Reporting

Jet Global

Inventory KPIs and metrics are crucial aspects of the reporting process. How to Build Useful KPI Dashboards. Why Inventory KPIs and Metrics Are Essential for Reporting? Tracking inventory KPIs and metrics allows businesses to identify areas in their business that need improvement and attention. Download Now. Reduce costs.

Metrics 52
article thumbnail

Top 35+ Finance KPIs and Metric Examples for 2020 Reporting

Jet Global

A financial Key Performance Indicator (KPI) or metric is a quantifiable measure that a company uses to gauge its financial performance over time. These three statements are data rich and full of financial metrics. How to Build Useful KPI Dashboards. The Fundamental Finance KPIs and Metrics – Cash Flow.

Metrics 98