Remove Dashboards Remove Interactive Remove Recreation/Entertainment Remove Visualization
article thumbnail

Bubble Wrap: How Eurovision Monitors Covid Risk at Events

CIO Business Intelligence

While pandemic-driven digital transformation has enabled the media and entertainment industry to stream awesome content 24/7 – digital technology is also safeguarding visitors, performing artist, and crew at the Eurovision Song Contest by monitoring their Covid-19 exposure levels in real time. So, how does it work?

Risk 97
article thumbnail

SANS Institute uses Amazon QuickSight to drive transformational security awareness maturity within organizations

AWS Big Data

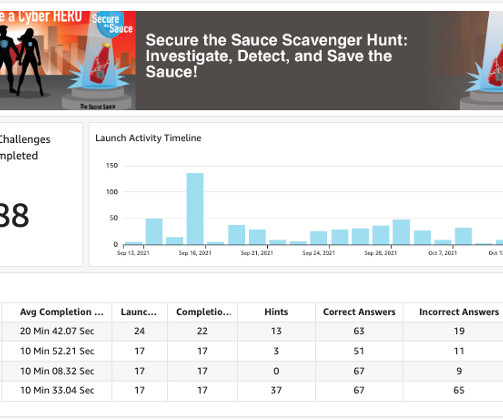
With it, we found an intuitive product with rich visualizations that we could build and grow with rapidly, allowing us to innovate without monetary risks or being locked in to cumbersome contracts. This being the case, we identified dashboards as a way to gamify the experience to increase engagement among participants.

Insiders

Sign Up for our Newsletter

This site is protected by reCAPTCHA and the Google Privacy Policy and Terms of Service apply.

Trending Sources

article thumbnail

Challenges in replacing SSRS with Microsoft Power BI

BizAcuity

It allows users to interact with information without involving any IT professionals. Power BI connects to data sources and analyzes what is important while allowing users to create and view reports and dashboards for a 360-degree view of the business from all the diverse sources. It provides a host of security features.

article thumbnail

“Small Barriers to Entry for New Players”

Juice Analytics

When it comes to data communication, we’ve said it a thousand times: Dashboards seldom provide guidance on where to start and how the user should navigate the information. Of course this is equally true when it comes to dashboards and data visualizations. What questions can we answer with this dashboard? Enjoy the video.

article thumbnail

Monetizing Analytics Features: Why Data Visualizations Will Never Be Enough

Think your customers will pay more for data visualizations in your application? But today, dashboards and visualizations have become table stakes. Five years ago they may have. Discover which features will differentiate your application and maximize the ROI of your embedded analytics. Brought to you by Logi Analytics.

article thumbnail

Real-Time Interactive Data Visualization Tools Reshaping Modern Business

Smart Data Collective

If the work of a human’s mind can be somehow represented, interactive data visualization is the closest form of such representation right before pure art. So, what is Interactive data visualization and how are they driven by modern interactive data visualization tools? Royalty-Free Photo.

article thumbnail

Challenges in replacing SSRS with Microsoft Power BI

BizAcuity

It allows users to interact with information without involving any IT professionals. Power BI connects to data sources and analyzes what is important while allowing users to create and view reports and dashboards for a 360-degree view of the business from all the diverse sources. It provides a host of security features.