Remove Dashboards Remove Interactive Remove Snapshot Remove Testing
article thumbnail

An Expert Under the Hood: White-Label Reports and Dashboards

Sisense

What are white-labeled reports White-label reports: Under the hood Exploring white-label dashboards Use case snapshots Horsepower under the hood. Data-Powered Apps delves into how product teams are infusing insights into applications and services to build products that will delight users and stand the test of time.

article thumbnail

Your Definitive Guide To KPI Tracking By Utilizing Modern Software & Tools

datapine

Your Chance: Want to test a professional KPI tracking software for free? Through visual KPI tracking tools such as a KPI dashboard , you uncover greater insights than you ever thought possible, streamlining your organization for success in an increasingly competitive digital landscape. KPI Tracking In Action: 3 Real-World Dashboards.

KPI 195
Insiders

Sign Up for our Newsletter

This site is protected by reCAPTCHA and the Google Privacy Policy and Terms of Service apply.

article thumbnail

Top 10 Management Reporting Best Practices To Create Effective Reports

datapine

When these reports are backed up with powerful visualizations developed with a dashboard creator , no information can stay hidden, eliminating thus the possibility of human errors and negative business impact. However, the use of dashboards, big data, and predictive analytics is changing the face of this kind of reporting.

Reporting 263
article thumbnail

10 Examples of How Big Data in Logistics Can Transform The Supply Chain

datapine

The rise of SaaS business intelligence tools is answering that need, providing a dynamic vessel for presenting and interacting with essential insights in a way that is digestible and accessible. Your Chance: Want to test a professional logistics analytics software? Your Chance: Want to test a professional logistics analytics software?

Big Data 275
article thumbnail

Everything You Need To Know About Static, Dynamic & Real Time Reporting

datapine

A static report offers a snapshot of trends, data, and information over a predetermined period to provide insight and serve as a decision-making guide. With dynamic data reports, users can log into a dashboard from anywhere across multiple devices for instant insight and analysis. What Is Static Reporting?

Reporting 109
article thumbnail

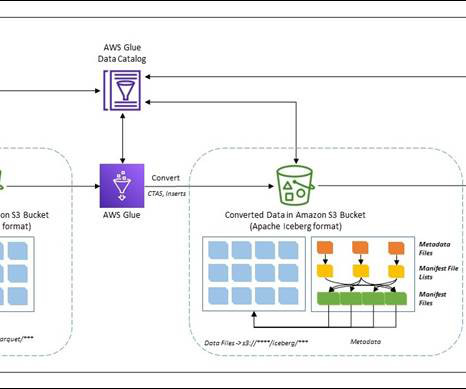
Migrate an existing data lake to a transactional data lake using Apache Iceberg

AWS Big Data

Amazon S3 allows you to access diverse data sets, build business intelligence dashboards, and accelerate the consumption of data by adopting a modern data architecture or data mesh pattern on Amazon Web Services (AWS). AWS Command Line Interface (AWS CLI) configured to interact with AWS Services. target_iceberg_add_files/metadata/.

article thumbnail

Move Beyond Excel, PowerPoint And Static Business Reporting with Powerful Interactive Dashboards

datapine

Soon businesses of all sizes will have so much amount of information that dashboard software will be the most invaluable resource a company can have. Visualizing the data and interacting on a single screen is no longer a luxury but a business necessity. That’s why we welcome you to the world of interactive dashboards.