Remove Dashboards Remove Key Performance Indicator Remove Marketing Remove Metrics
article thumbnail

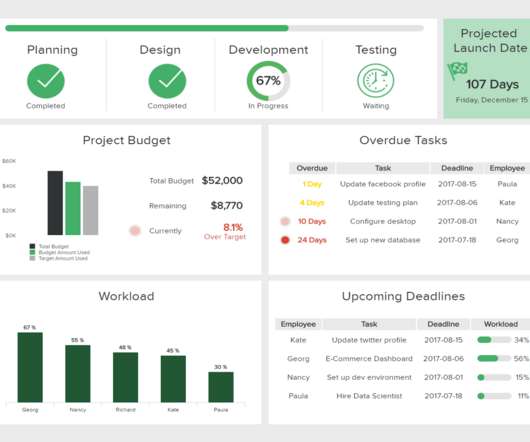
What Data Metrics Should Be Incorporated Into a Marketing Dashboard?

Smart Data Collective

Big data has been incredibly important in the marketing profession. Marketers need to rely heavily on big data technology to reach customers more effectively. Visual marketing dashboards are prime examples of using big data effectively in marketing. It acts the same as a car’s dashboard.

article thumbnail

KPIs vs Metrics: Understanding The Differences With Tips & Examples

datapine

2) What Are Metrics? 3) KPIs vs Metrics: Main Differences. 4) Tips For KPI & Metrics Tracking. Performance tracking has never been easier. With the rise of modern self-service BI tools , everyone can monitor relevant performance indicators in a matter of seconds. What Are Metrics? What Are KPIs?

Metrics 189
Insiders

Sign Up for our Newsletter

This site is protected by reCAPTCHA and the Google Privacy Policy and Terms of Service apply.

Trending Sources

article thumbnail

How Recruitment Metrics & Dashboards Can Help Improve Hiring New Candidates

datapine

That’s where recruitment metrics come in. By utilizing recruiting KPIs presented through the medium of visual and interactive HR dashboards , it’s possible to use recruitment metrics to better interpret and evaluate a variety of talent acquisition factors that aid in hiring processes. And why should you care? Let’s get started.

Metrics 210
article thumbnail

Your Introduction To CFO Dashboards & Reports In The Digital Age

datapine

CFO dashboards exist to enhance the strategic as well as the analytical efforts related to every financial aspect of your business. Here, we’ll explore the dynamics of reports for CFOs, look at CFO reporting tools, and consider real-world examples of both CFO dashboards and reports. Benefit from great CFO dashboards & reports!

article thumbnail

Make Sure You Know The Difference Between Strategic, Analytical, Operational And Tactical Dashboards

datapine

This is where the power of business dashboards comes into play. Dashboards often are the best way to gain insight into an organization and its various departments, operations and performance. Well-built, focused dashboards easily serve up summaries and reports of the BI that’s most critical to the organization.

article thumbnail

Take Advantage Of Operational Metrics & KPI Examples – A Comprehensive Guide

datapine

By establishing clear operational metrics and evaluate performance, companies have the advantage of using what is crucial to stay competitive in the market, and that’s data. Your Chance: Want to visualize & track operational metrics with ease? What Are Metrics And Why Are They Important?

KPI 269
article thumbnail

14 Dashboard Design Principles & Best Practices To Enhance Your Data Analysis

datapine

The rise of innovative, interactive, data-driven dashboard tools has made creating effective dashboards – like the one featured above – swift, simple, and accessible to today’s forward-thinking businesses. Dashboard design should be the cherry on top of your business intelligence (BI) project. Now, it’s time for the fun part.