article thumbnail

30 Best Manufacturing KPIs and Metric Examples for 2021 Reporting

Jet Global

What is an Operations KPI? An Operations Key Performance Indicator (KPI) or metric is a discrete measurement that a company uses to monitor and evaluate the efficiency of its day-to-day operations. These operations KPIs help management identify which operational strategies are effective, and those that inhibit the company.

Metrics 131
article thumbnail

Unlocking Growth Potential: A Guide to Effective KPI Tracking

FineReport

That’s where KPI tracking comes into play. In this article, we will explore the concept of KPI tracking, its definition, its importance for businesses, and how to perform KPI tracking. Additionally, we will provide real-life examples of KPI tracking dashboards and a step-by-step guide to setting up your own dashboard.

KPI 52
Insiders

Sign Up for our Newsletter

This site is protected by reCAPTCHA and the Google Privacy Policy and Terms of Service apply.

Trending Sources

article thumbnail

What is IoT Dashboard?

FineReport

You can download FineReport for free and have a try! Free Download of FineReport Visualizing Equipment Operation Status By visualizing sensor data, the manufacturing and facility management department can instantly grasp the operational status of the entire plant, as well as the equipment on each production line and any faulty equipment.

IoT 52
article thumbnail

Reporting Solutions: A Complete Guide

FineReport

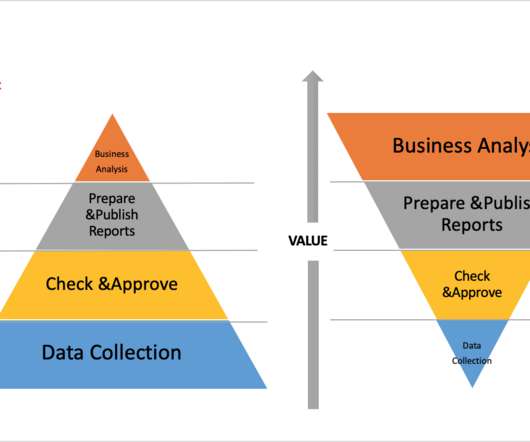
Besides, reporting solutions support managers put together a picture of the relevant data and discover business insides. For most companies, the staffs spend 50% time on data collection, 30% time on checking and approving the data, 15% time on developing and publishing the reports, and 5% on business analysis.

article thumbnail

Financial Dashboard: Definition, Examples, and How-tos

FineReport

You can download FineReport for free and have a try! Free Download of FineReport 1. Financial KPI Dashboard The financial KPI dashboard aggregates vital performance indicators that hold significant importance in business analysis and decision-making.

article thumbnail

A Beginner’s Guide to Financial Report: Definition, Types, Tools & Templates

FineReport

Free Download. Step 2: Collect financial data. Compared with other steps, data collection is a relatively tiring step in financial reporting. First, you need to collect and organize the original receipts. Step 3: Design report and visualize financial data. Financial KPI Dashboard.

article thumbnail

The Complete Digital Analytics Ecosystem: How To Win Big

Occam's Razor

A very special type of metric is designated to be a Key Performance Indicator (KPI). A KPI is a metric that helps you understand how you are doing against your objectives. This implies you cannot have a KPI identified unless you know what your objectives are. It will never be a KPI. Checking data collection quality etc.

Analytics 150