Remove Data Collection Remove KPI Remove Measurement Remove Reference
article thumbnail

KPI Management And Best Practices: How To Find The Perfect KPI Solutions?

datapine

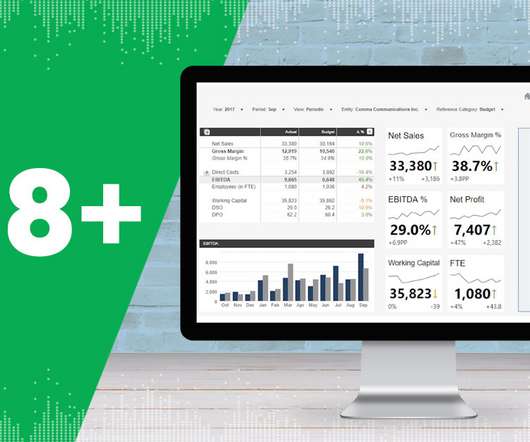
Table of Contents 1) What Is KPI Management? 2) Why Do KPIs Matter? 3) What Are KPI Best Practices? An even more interesting fact: The blogs we read regularly are not only influenced by KPI management but also concerning content, style, and flow; they’re often molded by the suggestions of these goal-driven metrics.

KPI 221
article thumbnail

Top Productivity Metrics Examples & KPIs To Measure Performance And Outcomes

datapine

2) How To Measure Productivity? For years, businesses have experimented and narrowed down the most effective measurements for productivity. There are a lot of KPI examples out there to monitor progress and assess productivity Likewise, there are a lot of guides on how to be productive at work. How To Measure Productivity?

Insiders

Sign Up for our Newsletter

This site is protected by reCAPTCHA and the Google Privacy Policy and Terms of Service apply.

article thumbnail

28 Best Insurance KPIs and Metrics Examples for 2020 Reporting

Jet Global

What Is an Insurance KPI? An insurance Key Performance Indicator (KPI) or metric is a measure that an insurance company uses to monitor its performance and efficiency. These KPIs are often used to compare companies in the insurance industry against each other to see which would be a better investment. View Guide Now.

article thumbnail

Top 35+ Distribution KPIs and Metric Examples for 2020 Reporting

Jet Global

What Is a Distribution KPI? A distribution Key Performance Indicator (KPI) or metric is a measure that a company in the distribution sector uses to monitor its performance and efficiency. As such, this post will go over distribution KPI examples that cover operational, lean, and financial performance. View Guide Now.

Metrics 52
article thumbnail

A Beginner’s Guide to Financial Report: Definition, Types, Tools & Templates

FineReport

An income statement, which also refers to a profit and loss report, shows an enterprise’s revenues, expenses, and net income in a certain period of time. Step 2: Collect financial data. Compared with other steps, data collection is a relatively tiring step in financial reporting. Financial KPI Dashboard.

article thumbnail

The Lean Analytics Cycle: Metrics > Hypothesis > Experiment > Act

Occam's Razor

We are far too enamored with data collection and reporting the standard metrics we love because others love them because someone else said they were nice so many years ago. First, you figure out what you want to improve; then you create an experiment; then you run the experiment; then you measure the results and decide what to do.

Metrics 156
article thumbnail

The Complete Digital Analytics Ecosystem: How To Win Big

Occam's Razor

A very special type of metric is designated to be a Key Performance Indicator (KPI). A KPI is a metric that helps you understand how you are doing against your objectives. This implies you cannot have a KPI identified unless you know what your objectives are. It will never be a KPI. Checking data collection quality etc.

Analytics 150