article thumbnail

Financial Dashboard: Definition, Examples, and How-tos

FineReport

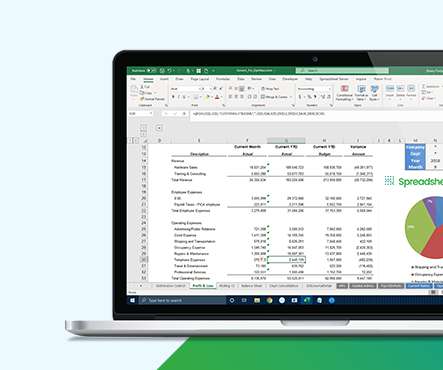
You can download FineReport for free and have a try! Free Download of FineReport 1. Financial Performance Dashboard The financial performance dashboard provides a comprehensive overview of key metrics related to your balance sheet, shedding light on the efficiency of your capital expenditure.

article thumbnail

Checklist of Data Dashboard for 2021? Definition, Examples & More

FineReport

Next, I will give you a focus on commonly used data dashboard types, and show some examples. If you are interested in these data dashboard templates, you can download FineReport for free. Free Download. Business Data Dashboard. Business Data Dashboard(made by FineReport). Marketing Data Dashboard.

Insiders

Sign Up for our Newsletter

This site is protected by reCAPTCHA and the Google Privacy Policy and Terms of Service apply.

article thumbnail

What is a KPI Report? Definition, Examples, and How-tos

FineReport

Key Performance Indicators (KPIs) serve as vital metrics that help measure progress towards business goals. To effectively monitor and analyze these metrics, businesses utilize KPI reports. You can download FineReport for free and have a try! Free Download of FineReport 1.

KPI 52
article thumbnail

Get started with AWS Glue Data Quality dynamic rules for ETL pipelines

AWS Big Data

Hundreds of thousands of organizations build data integration pipelines to extract and transform data. They establish data quality rules to ensure the extracted data is of high quality for accurate business decisions. These rules assess the data based on fixed criteria reflecting current business states.

article thumbnail

Daily Sales Report: Definition, Samples, Key Elements, and How-tos

FineReport

It includes key metrics such as total sales revenue, the number of units sold, average order value, and customer demographics. Daily Sales Report Sample Key Elements of Your Daily Sales Report There are several key metrics that businesses should include in their daily sales reports to gain insights into their sales performance.

Sales 52
article thumbnail

Extract data from SAP ERP using AWS Glue and the SAP SDK

AWS Big Data

Vyaire developed a custom data integration platform, iDataHub, powered by AWS services such as AWS Glue , AWS Lambda , and Amazon API Gateway. In this post, we share how we extracted data from SAP ERP using AWS Glue and the SAP SDK. For more information, refer to Download and Installation of NW RFC SDK. pem" ec2-user@10.XXX.XX.XXX

Testing 72
article thumbnail

Enhance monitoring and debugging for AWS Glue jobs using new job observability metrics: Part 2

AWS Big Data

AWS Glue has made this more straightforward with the launch of AWS Glue job observability metrics , which provide valuable insights into your data integration pipelines built on AWS Glue. This post, walks through how to integrate AWS Glue job observability metrics with Grafana using Amazon Managed Grafana.

Metrics 98