Remove Data Processing Remove Metrics Remove Optimization Remove Visualization
article thumbnail

Enhance monitoring and debugging for AWS Glue jobs using new job observability metrics, Part 3: Visualization and trend analysis using Amazon QuickSight

AWS Big Data

In Part 2 of this series, we discussed how to enable AWS Glue job observability metrics and integrate them with Grafana for real-time monitoring. QuickSight makes it straightforward for business users to visualize data in interactive dashboards and reports. Grafana provides powerful customizable dashboards to view pipeline health.

Metrics 101
article thumbnail

The Ultimate Guide to Modern Data Quality Management (DQM) For An Effective Data Quality Control Driven by The Right Metrics

datapine

6) Data Quality Metrics Examples. Reporting being part of an effective DQM, we will also go through some data quality metrics examples you can use to assess your efforts in the matter. The data quality analysis metrics of complete and accurate data are imperative to this step. Table of Contents. 2) Why Do You Need DQM?

Insiders

Sign Up for our Newsletter

This site is protected by reCAPTCHA and the Google Privacy Policy and Terms of Service apply.

article thumbnail

Your Introduction To CFO Dashboards & Reports In The Digital Age

datapine

Serving as a central, interactive hub for a host of essential fiscal information, CFO dashboards host dynamic financial KPIs and intuitive analytical tools, as well as consolidate data in a way that is digestible and improves the decision-making process. Top 7 CFO Dashboard KPIs & Metrics Explained. What Is A CFO Dashboard?

article thumbnail

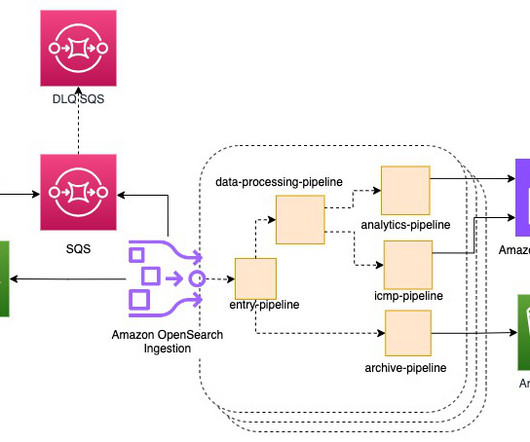
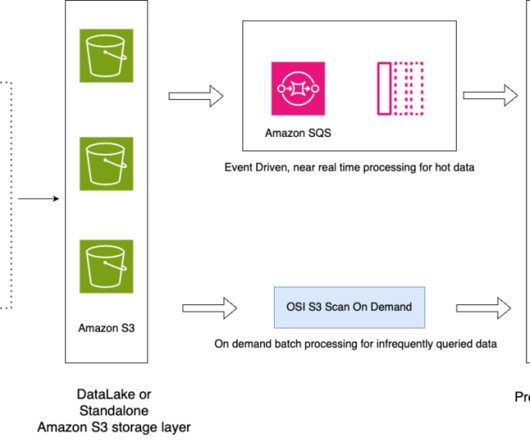
Enable cost-efficient operational analytics with Amazon OpenSearch Ingestion

AWS Big Data

The raw data stored in Amazon S3 can be inexpensively retained for an extended period of time using tiered storage and queried using the Athena query engine, and also visualized using Amazon QuickSight or other data visualization services. This limit is observed using the anomaly_detector.RCFInstances.value CloudWatch metric.

Analytics 117
article thumbnail

Best Dashboard Ideas & Design Examples To Boost Your Business Success

datapine

The ability to monitor, visualize, and analyze relevant data gives today’s businesses, across a host of sectors, the power to understand their prospects, make informed decisions, increase efficiencies, and work towards a set of rewarding long term goals. Best Dashboard Ideas You Can Get Inspiration From. click to enlarge**.

article thumbnail

How to achieve Kubernetes observability: Principles and best practices

IBM Big Data Hub

Observability comprises a range of processes and metrics that help teams gain actionable insights into a system’s internal state by examining system outputs. In this blog, we discuss how Kubernetes observability works, and how organizations can use it to optimize cloud-native IT architectures. How does observability work?

Metrics 72
article thumbnail

Utilize The Effectiveness Of Professional Executive Dashboards & Reports

datapine

By gaining the ability to gather, organize and analyze the metrics that are most important to your organization, you stand to make your business empire more intelligent than ever before – and executive reporting and business dashboards will help you do just that. 90% of the information transmitted to the brain is visual.