article thumbnail

Enhance monitoring and debugging for AWS Glue jobs using new job observability metrics, Part 3: Visualization and trend analysis using Amazon QuickSight

AWS Big Data

QuickSight makes it straightforward for business users to visualize data in interactive dashboards and reports. Analyzing historical patterns allows you to optimize performance, identify issues proactively, and improve planning. You can deploy the end-to-end solution to visualize and analyze trends of the observability metrics.

Metrics 108
article thumbnail

Big Data is Transforming the Future of WordPress Hosting

Smart Data Collective

Forbes contributor Kalev Leetaru recently wrote a fantastic article about the intersection of big data and website hosting. Leetaru notes that big data and cloud technology have led to the evolution of web hosting services. Cloud technology is changing the logistics of many traditional hosting plans. Determine Your Budget.
Insiders

Sign Up for our Newsletter

This site is protected by reCAPTCHA and the Google Privacy Policy and Terms of Service apply.

Trending Sources

article thumbnail

10 Examples of How Big Data in Logistics Can Transform The Supply Chain

datapine

You can use big data analytics in logistics, for instance, to optimize routing, improve factory processes, and create razor-sharp efficiency across the entire supply chain. Using the right dashboard and data visualizations, it’s possible to hone in on any trends or patterns that uncover inefficiencies within your processes.

Big Data 275
article thumbnail

Your Introduction To CFO Dashboards & Reports In The Digital Age

datapine

Serving as a central, interactive hub for a host of essential fiscal information, CFO dashboards host dynamic financial KPIs and intuitive analytical tools, as well as consolidate data in a way that is digestible and improves the decision-making process. CFO dashboard KPIs offer a digestible visual representation of what matters most.

article thumbnail

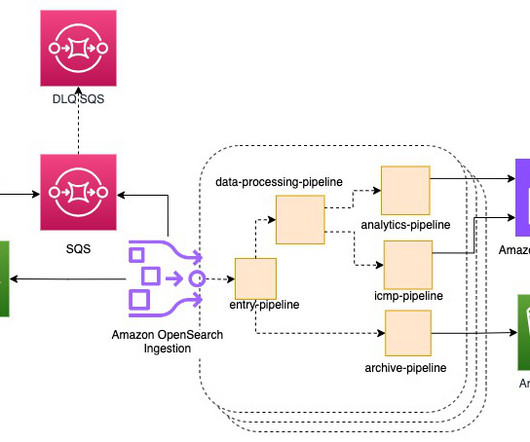
Enable cost-efficient operational analytics with Amazon OpenSearch Ingestion

AWS Big Data

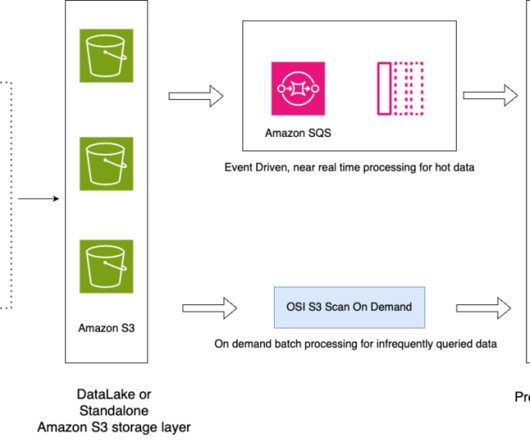
The raw data stored in Amazon S3 can be inexpensively retained for an extended period of time using tiered storage and queried using the Athena query engine, and also visualized using Amazon QuickSight or other data visualization services. Set up the VPC flow logs to publish logs to an S3 bucket in text format.

Analytics 123
article thumbnail

Revolutionizing database performance monitoring with DBmarlin and IBM Instana 

IBM Big Data Hub

Monitoring database performance can be a daunting task, especially in complex environments with a combination of both self-hosted and cloud-based databases. Optimizing database performance in agile development as a continuous process that aligns with development changes.

article thumbnail

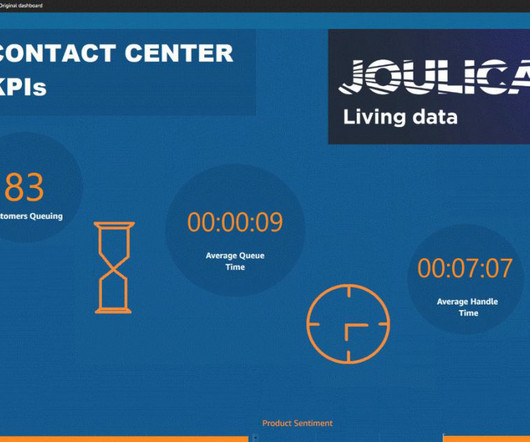
An Introduction To Data Dashboards: Meaning, Definition & Industry Examples

datapine

Data dashboards provide a centralized, interactive means of monitoring, measuring, analyzing, and extracting a wealth of business insights from relevant datasets in several key areas while displaying aggregated information in a way that is both intuitive and visual. Lack of different data visualization types.