Remove Data Warehouse Remove Demo Remove Key Performance Indicator Remove Reporting
article thumbnail

Financial Dashboard: Definition, Examples, and How-tos

FineReport

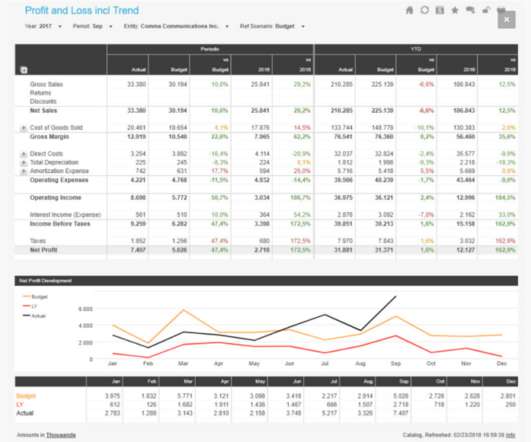
A financial dashboard, one of the most important types of data dashboards , functions as a business intelligence tool that enables finance and accounting teams to visually represent, monitor, and present financial key performance indicators (KPIs). Flexibility and adaptability are key to meeting evolving business demands.

article thumbnail

Goodbye Oracle Discoverer, Hello Next-Generation Reporting

Jet Global

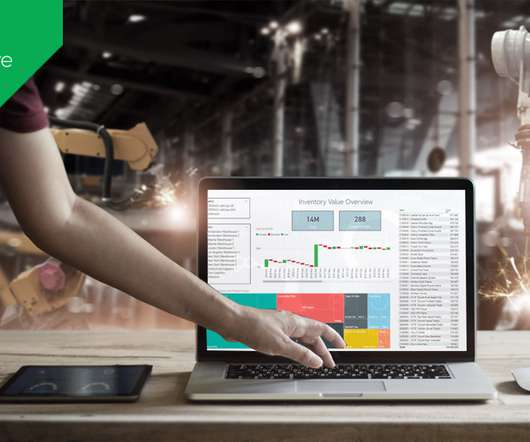
User interfaces for ERP reporting tools are most often built with IT staff in mind, not the end user. In a recent survey of ERP user satisfaction, almost half of the approximately 1,500 respondents said they needed easier access to information , with 35 percent indicating that access to information takes too long. View Solutions Now.

Insiders

Sign Up for our Newsletter

This site is protected by reCAPTCHA and the Google Privacy Policy and Terms of Service apply.

Trending Sources

article thumbnail

Business Intelligence vs. Reporting: Finding Your Bread and Butter

Jet Global

If you’re stumbling across this post through the sea of results researching “business intelligence vs. reporting,” then maybe you’re already familiar with the unlimited interpretations and definitions of these two practices. How to Compare Reporting & BI Solutions. in “business intelligence vs. reporting” is a bit misleading.

article thumbnail

Top 5 EPM Reporting Templates

Jet Global

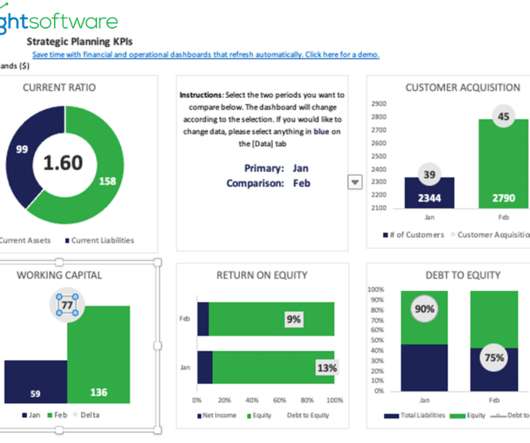
Whether it is a sales performance dashboard, a snapshot of A/R collections, a trends analysis dashboard, a marketing performance app, or a variance-to-Year 12-month view report, EPM reporting can be a powerful tool in helping your organization meet its objectives. EPM reporting templates offer the perfect solution.

article thumbnail

How Data-Driven Decisions Boost the Future of Industrial Manufacturing

Jet Global

In fact, according to a recent survey , two-thirds of manufacturing leaders indicated they had not maximized the potential benefits of analytics for operational insights and decision making. . Managing this increasing amount of data can wreak havoc on your financial teams. Or reporting across multiple manufacturing units?

article thumbnail

Best Web Analytics 2.0 Tools: Quantitative, Qualitative, Life Saving!

Occam's Razor

If after rigorous analysis you have determined that you have evolved to a stage that you need a data warehouse then you are out of luck with Yahoo! If you can show ROI on a DW it would be a good use of your money to go with Omniture Discover, WebTrends Data Mart, Coremetrics Explore. of these three tools: ~ Yahoo! You may not.

Analytics 135
article thumbnail

Mastering BI Dashboard Tools: Your Essential Guide

FineReport

Key Features of BI Dashboards: Customizable interface Interactivity Real-time data accessibility Web browser compatibility Predefined templates Collaborative sharing capabilities BI Dashboards vs. BI Reports: While both dashboards and reports are pivotal in business intelligence, they serve distinct purposes.