Remove Data Warehouse Remove Forecasting Remove Operational Reporting Remove Visualization
article thumbnail

Five Key Questions to Help Speed JD Edwards Financial Reporting

Jet Global

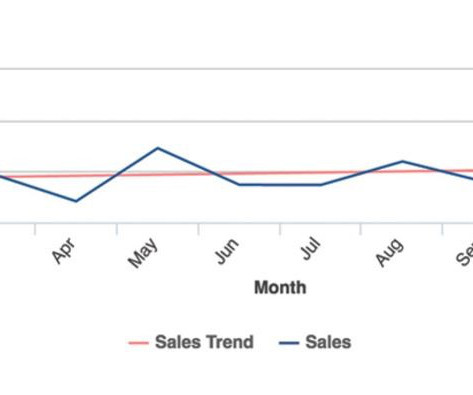
While JD Edwards transactional data is required to run period close reports, analyze trends, and prepare forecasts for planning and budgeting, it comes with a lot of complexity. JD Edwards World has no less than 1600 tables of data to support just its business applications. Each table can be huge.

article thumbnail

Upcoming Power BI Workshop in Huntington Beach, CA – Apr 10, 2015

Ms SQL Girl

Actionable Visualization In Power BI. Her recent projects include delivering a SQL Server 2012 Data Warehouse and BI solutions for a number of high profile clients in the US and Australia. Acquiring and Preparing Data for Power View and Excel. Data Modelling Patterns 101 Using Power Pivot. Regular price $109.00.

Insiders

Sign Up for our Newsletter

This site is protected by reCAPTCHA and the Google Privacy Policy and Terms of Service apply.

article thumbnail

Upcoming Power BI Workshop in Huntington Beach, CA – Apr 10, 2015

Ms SQL Girl

Actionable Visualization In Power BI. Her recent projects include delivering a SQL Server 2012 Data Warehouse and BI solutions for a number of high profile clients in the US and Australia. Acquiring and Preparing Data for Power View and Excel. Data Modelling Patterns 101 Using Power Pivot. Regular price $109.00.

article thumbnail

Use the Cloud to Up Your Operational Reporting Game

Jet Global

Enter operational reporting, the change agent in our story. In the past year alone, a staggering 66% of IT decision-makers have witnessed a surge in requests for operational reports. Recent findings highlight the increasing importance of operational reporting and the significant impact it has on organizations.

article thumbnail

Comparing Data Visualizations: Bar vs. Stacked, Icons vs. Shapes, and Line vs. Area

Jet Global

Great data visualizations have the power to persuade decision makers to take immediate, appropriate action. When done well, data visualizations help users intuitively grasp data at a glance and provide more meaningful views of information in context. Modern data visualization platforms offer countless options.

article thumbnail

Shared Data Reporting: Deep Excel Functionality Meets Web-Based Dashboards

Jet Global

Surprisingly, according to insightsoftware and Hanover Research’s report on operational reporting , 98% of businesses still distribute reports via a static PDF. By adopting self-service reporting, you can generate reports custom-suited to your needs while freeing up time from your IT department.

article thumbnail

Building a Functional Ecosystem: Nine Ways to Boost Your Finance-Tax Synergy

Jet Global

This ensures that all financial data changes and tax-related decisions are well-documented, making it easier to respond to regulatory inquiries or audits. Forecasting and Planning. Integration between these tools allows for more accurate financial forecasting and planning. Increased Visualization Sophistication.

Finance 52