Remove Data Warehouse Remove Key Performance Indicator Remove KPI Remove Reporting
article thumbnail

Your Data Won’t Speak Unless You Ask It The Right Data Analysis Questions

datapine

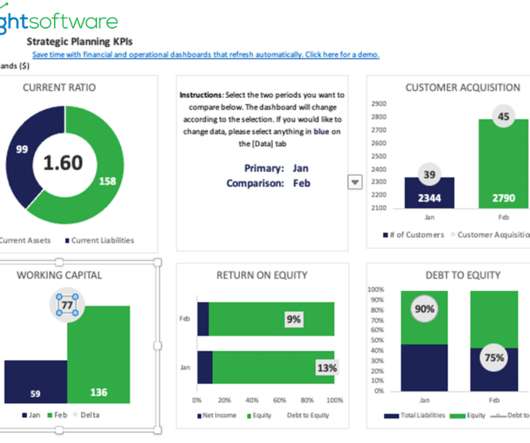
Agree companywide what KPIs are most relevant for your business and how do they already develop. Research different KPI examples and compare to your own. If nothing can be changed, there is no point of analyzing data. If nothing can be changed, there is no point of analyzing data. ETL data warehouse*.

IT 317
article thumbnail

Financial Dashboard: Definition, Examples, and How-tos

FineReport

A financial dashboard, one of the most important types of data dashboards , functions as a business intelligence tool that enables finance and accounting teams to visually represent, monitor, and present financial key performance indicators (KPIs).

Insiders

Sign Up for our Newsletter

This site is protected by reCAPTCHA and the Google Privacy Policy and Terms of Service apply.

article thumbnail

Introduction To The Basic Business Intelligence Concepts

datapine

Business intelligence concepts refer to the usage of digital computing technologies in the form of data warehouses, analytics and visualization with the aim of identifying and analyzing essential business-based data to generate new, actionable corporate insights. The data warehouse. 1) The raw data.

article thumbnail

Common Business Intelligence Challenges Facing Entrepreneurs

datapine

In addition to increasing the price of deployment, setting up these data warehouses and processors also impacted expensive IT labor resources. The ROI alone from hours saved and reduced costs of producing current reports will improve your bottom line. At a small business, a data culture may not exist yet.

article thumbnail

CCPA 2020: Getting Your Data Landscape Ready

Octopai

You can’t do this easily without automated data lineage tools. Octopai’s metadata discovery and management suite provides visualization tools that empower you to see and report everything about sensitive customer data. – KPI planning – Are your dashboard key performance indicators (KPIs) telling the whole story?

article thumbnail

A Guide To Starting A Career In Business Intelligence & The BI Skills You Need

datapine

Being able to clearly see how the data changes in time is what makes it possible to extract relevant conclusions from it. For this purpose, you should be able to differentiate between various charts and report types as well as understand when and how to use them to benefit the BI process. Business Intelligence Job Roles.

article thumbnail

Business Intelligence vs. Reporting: Finding Your Bread and Butter

Jet Global

If you’re stumbling across this post through the sea of results researching “business intelligence vs. reporting,” then maybe you’re already familiar with the unlimited interpretations and definitions of these two practices. How to Compare Reporting & BI Solutions. in “business intelligence vs. reporting” is a bit misleading.