Remove Data Warehouse Remove Metrics Remove Operational Reporting Remove Visualization
article thumbnail

What is a Data Pipeline?

Jet Global

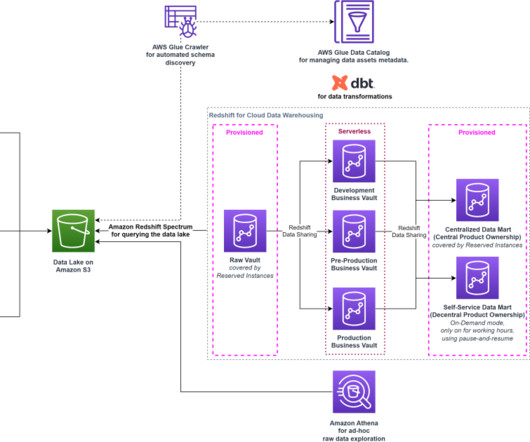
The key components of a data pipeline are typically: Data Sources : The origin of the data, such as a relational database , data warehouse, data lake , file, API, or other data store. This can include tasks such as data ingestion, cleansing, filtering, aggregation, or standardization.

article thumbnail

How smava makes loans transparent and affordable using Amazon Redshift Serverless

AWS Big Data

The data products used inside the company include insights from user journeys, operational reports, and marketing campaign results, among others. The data platform serves on average 60 thousand queries per day. The data volume is in double-digit TBs with steady growth as business and data sources evolve.

Insiders

Sign Up for our Newsletter

This site is protected by reCAPTCHA and the Google Privacy Policy and Terms of Service apply.

Trending Sources

article thumbnail

Two Birds, One Stone: How to Get Better AX Reporting and Prepare for Future D365 Migration Today

Jet Global

Current economic conditions call for greater visibility to inventory and the supply chain and closer attention to key financial metrics. With Jet Analytics, the customer has streamlined that process and vastly simplified intercompany reports. Unfortunately, Power BI is poorly suited to financial and operational reporting.

article thumbnail

Are You in Control of Your JDE or EBS Data?

Jet Global

They need a solution that doesn’t require complex technical tools to dig into their master data for the meaningful insights they must deliver. Accessing a vast library of pre-built, turnkey content templates for finance and operations reporting can ensure your team a fast time to value with minimal training required.

article thumbnail

4 Reasons Why You Should Upgrade to Hubble Enterprise

Jet Global

The Delays and Shortcomings that Hold Your Team Back For many JD Edwards and Oracle EBS customers, financial and operational reporting is a slow, manual process that is overly reliant on support from IT. Without the right interactive reporting tools, they may find themselves unable to access automatic calculations and data checks.

article thumbnail

Partners in Innovation: Voice of the Customer Enhancements to Logi Symphony

Jet Global

View mode must respect interactivity, responsive layout and limit operations with dashboard. New Dashboard Layout allows “locking” visual position, swap visual position and adaptive layout for mobile devices. Label Positioning allows labels for visuals to be positioned on axis with different orientation.

article thumbnail

10+ Government KPIs for 2024 Reporting

Jet Global

The constituents cannot hold their government responsible without having access to periodic reporting on key performance metrics. They indicate the expected level of performance by attaching a target to each metric. Cross-sectional metrics : Ensure that you have KPIs for every department within the organization.