article thumbnail

Your Definitive Guide To KPI Tracking By Utilizing Modern Software & Tools

datapine

Whatever your niche or industry, working with dynamic key performance indicators (KPIs) will empower you to track and improve your performance in a number of key areas, accelerating your commercial success in the process. Your Chance: Want to test a professional KPI tracking software for free? What Is KPI Tracking?

KPI 195
article thumbnail

An Introduction To Data Dashboards: Meaning, Definition & Industry Examples

datapine

To help you understand this notion in full, we’re going to explore a data dashboard definition, explain the power of dashboard data, and explore a selection of data dashboard examples. These are measured through Key Performance Indicators (KPIs), which provide insights that help to foster growth and improvement.

Insiders

Sign Up for our Newsletter

This site is protected by reCAPTCHA and the Google Privacy Policy and Terms of Service apply.

article thumbnail

Your Definitive Guide To Building Valuable Narratives Through Data Storytelling

datapine

Exclusive Bonus Content: Your definitive guide to data storytelling! Storytelling through data is the process of transforming data-driven analyses into a widely-accessible visual format to influence a business decision, strategy, or action by utilizing analytical information that, ultimately, turn into actionable insights.

KPI 193
article thumbnail

What is a KPI Report? Definition, Examples, and How-tos

FineReport

Key Performance Indicators (KPIs) serve as vital metrics that help measure progress towards business goals. A KPI report, also known as KPI reporting, serves as a management tool for measuring, organizing, and analyzing the primary key performance indicators that are vital to a business.

KPI 52
article thumbnail

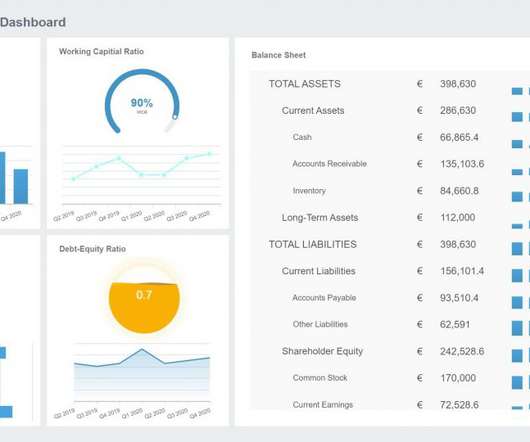
Financial Dashboard: Definition, Examples, and How-tos

FineReport

A financial dashboard, one of the most important types of data dashboards , functions as a business intelligence tool that enables finance and accounting teams to visually represent, monitor, and present financial key performance indicators (KPIs).

article thumbnail

Checklist of Data Dashboard for 2021? Definition, Examples & More

FineReport

Definition. Undoubtedly, a data dashboard tool helps you answer a barrage of business-related questions in order to cater to your own strategies. Here are the main features: in-depth appreciation of marketing performance frequent and timely course corrections. Definition, Examples & More shows at FineReport first.

article thumbnail

KPIs vs Metrics: Understanding The Differences With Tips & Examples

datapine

That being said, this post will cover the main difference between metrics and KPIs as well as some examples and tips for efficient performance tracking. Let’s quick it off with the definition of metrics and KPIs! Choosing the right KPIs to measure is probably the most important step to track your strategies in an efficient way.

Metrics 189