Remove Definition Remove Key Performance Indicator Remove Metrics Remove Strategy
article thumbnail

Top 15 Warehouse KPIs & Metrics For Efficient Management 

datapine

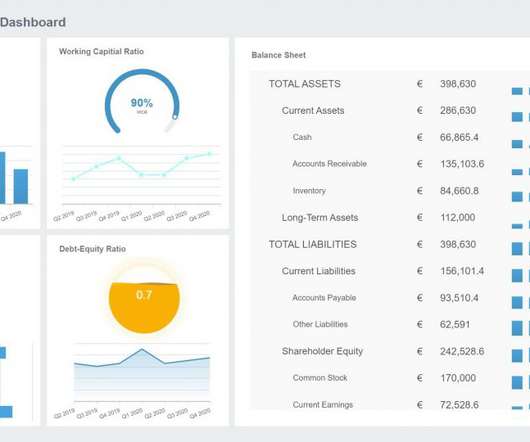
Every day, more and more businesses realize the value of analyzing their own performance to boost strategies and achieve their goals. With the help of the right logistics analytics tools, warehouse managers can track powerful metrics and KPIs and extract trends and patterns to ensure everything is running at its maximum potential.

Metrics 217
article thumbnail

KPIs vs Metrics: Understanding The Differences With Tips & Examples

datapine

2) What Are Metrics? 3) KPIs vs Metrics: Main Differences. 4) Tips For KPI & Metrics Tracking. Performance tracking has never been easier. With the rise of modern self-service BI tools , everyone can monitor relevant performance indicators in a matter of seconds. What Are Metrics? What Are KPIs?

Metrics 189
Insiders

Sign Up for our Newsletter

This site is protected by reCAPTCHA and the Google Privacy Policy and Terms of Service apply.

Trending Sources

article thumbnail

Your Definitive Guide To KPI Tracking By Utilizing Modern Software & Tools

datapine

Whatever your niche or industry, working with dynamic key performance indicators (KPIs) will empower you to track and improve your performance in a number of key areas, accelerating your commercial success in the process. But first, let’s ask ourselves the question, ‘ What is KPI tracking?’. What Is KPI Tracking?

KPI 195
article thumbnail

Take Advantage Of Operational Metrics & KPI Examples – A Comprehensive Guide

datapine

By establishing clear operational metrics and evaluate performance, companies have the advantage of using what is crucial to stay competitive in the market, and that’s data. Your Chance: Want to visualize & track operational metrics with ease? What Are Metrics And Why Are They Important?

KPI 269
article thumbnail

Your Definitive Guide To Building Valuable Narratives Through Data Storytelling

datapine

Exclusive Bonus Content: Your definitive guide to data storytelling! Storytelling through data is the process of transforming data-driven analyses into a widely-accessible visual format to influence a business decision, strategy, or action by utilizing analytical information that, ultimately, turn into actionable insights.

KPI 193
article thumbnail

Misled by metrics: 7 KPI mistakes IT leaders make

CIO Business Intelligence

Today, many CIOs feel the same way about metrics. Metrics are only as good as their source. Too often, technology companies pay consulting or analyst firms to create metrics based on the best characteristics of their offerings,” says Judith Hurwitz, CEO of Hurwitz Strategies, an emerging technology consulting firm.

Metrics 131
article thumbnail

An Introduction To Data Dashboards: Meaning, Definition & Industry Examples

datapine

To help you understand this notion in full, we’re going to explore a data dashboard definition, explain the power of dashboard data, and explore a selection of data dashboard examples. These are measured through Key Performance Indicators (KPIs), which provide insights that help to foster growth and improvement.