Remove Download Remove Key Performance Indicator Remove Measurement Remove Visualization
article thumbnail

What Is Dashboard—Definition, Purposes and Examples

FineReport

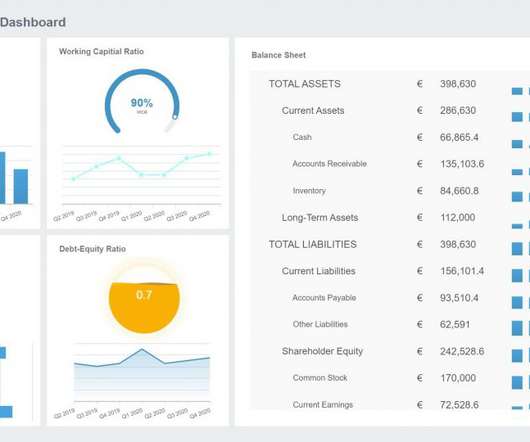
Actually, it, to be specific, is a type of graphical user interface that often offers intelligent views of key performance indicators (KPIs) related to certain objectives or business processes. The tool is also a kind of “report” with a form of data visualization. Download and use FineReport now!

article thumbnail

What is a KPI Report? Definition, Examples, and How-tos

FineReport

Key Performance Indicators (KPIs) serve as vital metrics that help measure progress towards business goals. A KPI report, also known as KPI reporting, serves as a management tool for measuring, organizing, and analyzing the primary key performance indicators that are vital to a business.

KPI 52
Insiders

Sign Up for our Newsletter

This site is protected by reCAPTCHA and the Google Privacy Policy and Terms of Service apply.

article thumbnail

Scorecard vs Dashboard: How to Choose to Maximize Your Benefits?

FineReport

Scorecards use excellent visual effects to present key performance indicators (KPIs), which can help companies compare predicted targets with actual conditions to measure and manage business performance. If you are seeking a great combination of scorecard and dashboard, download and use FineReport now!

article thumbnail

A Guide To The Methods, Benefits & Problems of The Interpretation of Data

datapine

Capable of displaying key performance indicators (KPIs) for both quantitative and qualitative data analyses, they are ideal for making the fast-paced and data-driven market decisions that push today’s industry leaders to sustainable success. Exclusive Bonus Content: Download Our Free Data Analysis Guide.

article thumbnail

Your Definitive Guide To Building Valuable Narratives Through Data Storytelling

datapine

By gaining centralized access to business data and presenting it in a visual way that follows a logical path and provides invaluable insights on a particular area or subject, you stand to set yourself apart from your competitors and become a leader in your field. Download our free executive summary and start creating your stories!

KPI 193
article thumbnail

Take Advantage Of Modern CEO Dashboards – Examples And Templates

datapine

Download our short summary and become the best leader you can be! A CEO dashboard is an interactive platform that visualizes data to empower business leaders to track, measure, analyze, and monitor business performance in a number of areas, enabling them to make data-driven decisions and see the big business picture.

article thumbnail

Checklist of Data Dashboard for 2021? Definition, Examples & More

FineReport

Similar to the instrument panel equipped in a car, it transforms obscure expertise into plain visualizations which are pleasing to both the eye and mind. A data dashboard is a useful tool that could display and analyze users’ complex data by means of data visualization so that the user gains a deep insight into the value of data.