article thumbnail

Measure performance of AWS Glue Data Quality for ETL pipelines

AWS Big Data

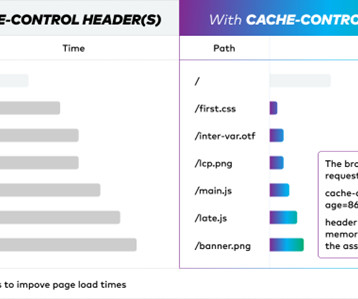
As part of the results, we show how AWS Glue Data Quality provides information about the runtime of extract, transform, and load (ETL) jobs, the resources measured in terms of data processing units (DPUs), and how you can track the cost of running AWS Glue Data Quality for ETL pipelines by defining custom cost reporting in AWS Cost Explorer.

article thumbnail

A Guide To The Methods, Benefits & Problems of The Interpretation of Data

datapine

Through the art of streamlined visual communication, data dashboards permit businesses to engage in real-time and informed decision-making and are key instruments in data interpretation. Exclusive Bonus Content: Download Our Free Data Analysis Guide. Exclusive Bonus Content: Download Our Free Data Analysis Guide.

Insiders

Sign Up for our Newsletter

This site is protected by reCAPTCHA and the Google Privacy Policy and Terms of Service apply.

Trending Sources

article thumbnail

8 Examples Of Financial Reports You Can Use For Daily, Weekly, And Monthly Reports

datapine

A data-driven finance report is also an effective means of remaining updated with any significant progress or changes in the status of your finances, and help you measure your financial results, cash flow, and financial position. Download our short executive guide to daily, weekly and monthly reports! What Is A Finance Report?

Reporting 251
article thumbnail

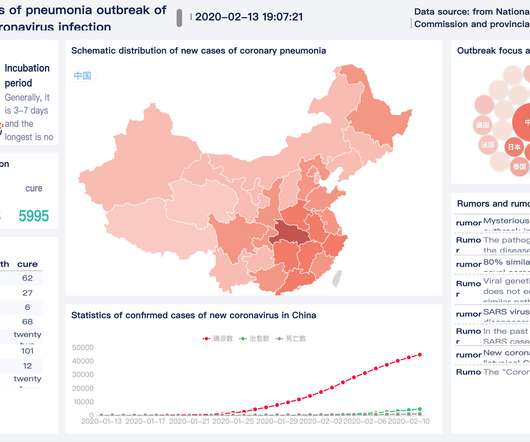
What Can Data Visualization Help in the Battle against the Novel Coronavirus?

FineReport

To this end, I’ve used the knowledge of data visualization to design dashboard templates for five scenarios, hoping to help relevant organizations or enterprises effectively monitor the epidemic situation and carry out prevention and control work. You can download it to practice making reports and dashboards. Hospital management.

article thumbnail

Take Advantage Of Modern CEO Dashboards – Examples And Templates

datapine

Download our short summary and become the best leader you can be! A CEO dashboard is an interactive platform that visualizes data to empower business leaders to track, measure, analyze, and monitor business performance in a number of areas, enabling them to make data-driven decisions and see the big business picture.

article thumbnail

Extend Power BI with Custom Visuals

Jet Global

As one of the most widely used data visualization tools in the world, Power BI has made some huge improvements to creating custom visualizations that we want to share with you. When creating or editing a Power BI dashboard, you have access to a ton of different types of visuals. Custom Visuals for Power BI.

article thumbnail

Your Definitive Guide To Building Valuable Narratives Through Data Storytelling

datapine

By gaining centralized access to business data and presenting it in a visual way that follows a logical path and provides invaluable insights on a particular area or subject, you stand to set yourself apart from your competitors and become a leader in your field. Download our free executive summary and start creating your stories!

KPI 193