Remove Finance Remove Forecasting Remove Metrics Remove Visualization
article thumbnail

DirectX Visualization Optimizes Analytics Algorithmic Traders

Smart Data Collective

Learn how DirectX visualization can improve your study and assessment of different trading instruments for maximum productivity and profitability. Let’s dive right into how DirectX visualization can boost analytics and facilitate testing for you as an Algo-trader, quant fund manager, etc. But first, What is DirectX Anyway?

article thumbnail

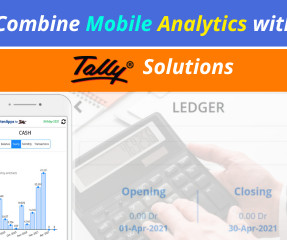
Combine Mobile Analytics with Tally Solutions!

Smarten

If you are a Tally ERP or a Tally Prime user, you know the value of the comprehensive financial management solution for managing accounting, inventory, purchasing, sales, finances, taxes, etc. Original Post : Mobile Augmented Analytics for Tally Provides an Advantage!

Insiders

Sign Up for our Newsletter

This site is protected by reCAPTCHA and the Google Privacy Policy and Terms of Service apply.

article thumbnail

Elevate Financial Intelligence with Data Visualization

Jet Global

When the prognosticators at Gartner start forecasting the future, people tend to pay attention. That needs to change as analytics becomes one of the finance department’s core responsibilities. Failure to do so only makes the finance department less intelligent and agile. Data Visualizations: Past and Present.

article thumbnail

Discover The Power Of Modern Performance Reports – See Examples & Best Practices 

datapine

A performance report is an analytical tool that offers a visual overview of how a business is performing in a specific strategy, project, or department. That said, the true value of these reports lies mainly in their visual nature. We are talking about sales, finances, customer service, human resources, and more.

Reporting 207
article thumbnail

eCommerce Brands Use Data Analytics for Conversion Rate Optimization

Smart Data Collective

Understanding E-commerce Conversion Rates There are a number of metrics that data-driven e-commerce companies need to focus on. It is a crucial metric that provides priceless information about your website’s ability to transform visitors into paying customers. Some of the most important is conversion rates.

article thumbnail

Get Started With Business Performance Dashboards – Examples & Templates

datapine

By harnessing the insights, information, and metrics that are most valuable to key aspects of your business and understanding how to take meaningful actions from your data, you will ensure your business remains robust, resilient, and competitive. The Link Between Data And Business Performance. What Is A Performance Dashboard In Business?

article thumbnail

How can CIOs Build Business Value with Business Analytics?

Smart Data Collective

Based on the engagement with the product, the customer experience team, a key part of the CIO’s team has to score customers on these metrics and position them in the growth funnel, also known as the pirate funnel. . For most organizations, it sets the narrative for project forecasting, recruiting, scaling, and others. Conclusion.