article thumbnail

Chat with PDFs | Empowering Textual Interaction with Python and OpenAI

Analytics Vidhya

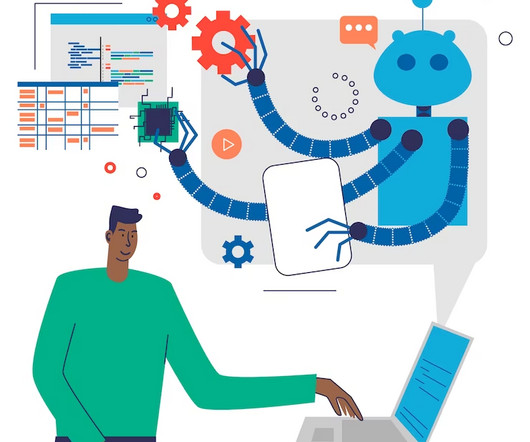
Introduction In a world filled with information, PDF documents have become a staple for sharing and preserving valuable data. That’s where “Chat with PDFs” comes to the rescue – an innovative project revolutionising how we interact with PDFs.

article thumbnail

Building an Interactive Dashboard using Bokeh and Pandas

Analytics Vidhya

Companies are extracting useful information from such generated data to make important business decisions. The post Building an Interactive Dashboard using Bokeh and Pandas appeared first on Analytics Vidhya. Exploratory Data analysis can help […].

Insiders

Sign Up for our Newsletter

This site is protected by reCAPTCHA and the Google Privacy Policy and Terms of Service apply.

article thumbnail

How Semantic Vector Search Transforms Customer Support Interactions

KDnuggets

Semantic vector search is an advanced search technique revolutionizes how we interact with information by understanding the true meaning of words, thus leading to more relevant and insightful results.

article thumbnail

Run interactive workloads on Amazon EMR Serverless from Amazon EMR Studio

AWS Big Data

Starting from release 6.14, Amazon EMR Studio supports interactive analytics on Amazon EMR Serverless. Create an EMR Studio and Workspace The EMR Studio administrator should log in to the console using the emrs-interactive-app-admin-user user credentials. For Name , enter a name (for example, my-serverless-interactive-application ).

article thumbnail

Put Your Data to Work: The Complete Playbook

An interactive guide filled with the tools to turn your data into a competitive advantage. From search engines to navigation systems, data is used to fuel products, manage risk, inform business strategy, create competitive analysis reports, provide direct marketing services, and much more.

article thumbnail

Enforce boundaries on AWS Glue interactive sessions

AWS Big Data

AWS Glue interactive sessions allow engineers to build, test, and run data preparation and analytics workloads in an interactive notebook. Interactive sessions provide isolated development environments, take care of the underlying compute cluster, and allow for configuration to stop idling resources. The function is the control.

article thumbnail

Understanding Digital Interactions in Real-Time

CIO Business Intelligence

The insights provided by analytics “in the moment” can uncover valuable information in customer interactions and alert users or trigger responses as events happen. All interactions are digital interactions. In a business context, this is defined as an interaction. billion market by 2026. It’s no surprise.

article thumbnail

How to Stay Competitive in the Evolving State of Martech

To help practitioners keep up with the rapidly evolving martech landscape, this special report will discuss: How practitioners are integrating technologies and systems to encourage information-sharing between departments and promote omnichannel marketing.

article thumbnail

Embedding Operational Reports: Everything Product Managers Should Know

Speaker: Dean Yao, Sr. Director of Product Marketing, Logi Analytics

Operational reports help get information to the people who need it most, in formats they understand, and in a timeframe that matters. Businesses are run with analytics - but companies continue to struggle with interpreting, analyzing, and distributing data. You’ll learn: Best practices for embedding operational reports in your application.

article thumbnail

The Ultimate Embedded Analytics Guide

In today’s ambitious business environment, customers want access to an application’s data with the ability to interact with the data in a way that allows them to derive business value. After all, customers rely on your application to help them understand the data that it holds, especially in our increasingly data-savvy world.

article thumbnail

Monetizing Analytics Features: Why Data Visualizations Will Never Be Enough

Think your customers will pay more for data visualizations in your application? Five years ago they may have. But today, dashboards and visualizations have become table stakes. Discover which features will differentiate your application and maximize the ROI of your embedded analytics. Brought to you by Logi Analytics.