Remove Interactive Remove Key Performance Indicator Remove Modeling Remove Testing
article thumbnail

Smarten Announces SnapShot Anomaly Monitoring Alerts: Powerful Tools for Business Users!

Smarten

Smarten CEO, Kartik Patel says, ‘Smarten SnapShot supports the evolving role of Citizen Data Scientists with interactive tools that allow a business user to gather information, establish metrics and key performance indicators.’

article thumbnail

Conversational AI use cases for enterprises

IBM Big Data Hub

The emergence of NLG has dramatically improved the quality of automated customer service tools, making interactions more pleasant for users, and reducing reliance on human agents for routine inquiries. DL models can improve over time through further training and exposure to more data. billion by 2030.

Insiders

Sign Up for our Newsletter

This site is protected by reCAPTCHA and the Google Privacy Policy and Terms of Service apply.

article thumbnail

Big Data Proves Invaluable to Retail Supply Chain Management

Smart Data Collective

They have found that the pandemic has completely upended their business models, as customers shift towards online commerce. This has driven many companies to find more innovative ecommerce marketing models that rely on big data. Analytics solutions can compare actual vendor performance against your key performance indicators (KPIs).

Big Data 111
article thumbnail

Do I Need Both BI Tools and Augmented Analytics?

Smarten

Recent studies have focused on the trends in business intelligence and augmented analytics, predicting that businesses will grow analytics within the enterprise with: Augmented Analytics to enable non-technical business users to create sophisticated data models. Predictive Modeling to support business needs, forecast, and test theories.

article thumbnail

A Guide To The Methods, Benefits & Problems of The Interpretation of Data

datapine

Capable of displaying key performance indicators (KPIs) for both quantitative and qualitative data analyses, they are ideal for making the fast-paced and data-driven market decisions that push today’s industry leaders to sustainable success. To cut costs and reduce test time, Intel implemented predictive data analyses.

article thumbnail

The Lean Analytics Cycle: Metrics > Hypothesis > Experiment > Act

Occam's Razor

Sometimes, we escape the clutches of this sub optimal existence and do pick good metrics or engage in simple A/B testing. Let's listen in as Alistair discusses the lean analytics model… The Lean Analytics Cycle is a simple, four-step process that shows you how to improve a part of your business. Testing out a new feature.

Metrics 156
article thumbnail

Analytics On The Bleeding Edge: Transforming Data's Influence

Occam's Razor

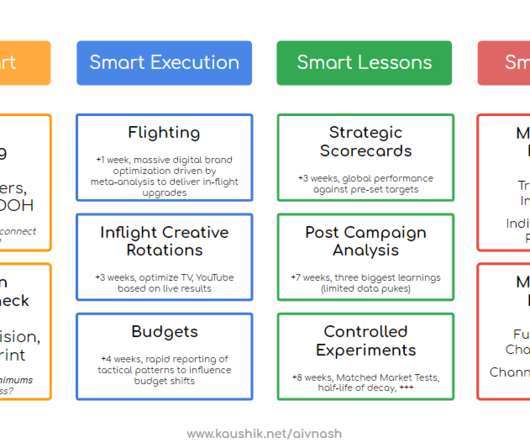
The other dimension to consider is most Analtyics teams kick into gear after the campaign is concluded, after the customer interaction has taken place in the call center, and after the funds budgeted have already been spent. The first component is a gloriously scaled global creative pre-testing program. Matched market tests.

Analytics 131