Remove Interactive Remove Key Performance Indicator Remove Statistics Remove Testing
article thumbnail

4 Ways To Grow Your Business With Big Data

Smart Data Collective

Outside of that, it is important to know how your customers interact with your products, buying trends, what devices they use, what times they like to shop, and so much more. Possible goals could be to increase conversion for an underperforming product or to test market-fit for a new product. Test first.

Big Data 128
article thumbnail

Smarten Announces SnapShot Anomaly Monitoring Alerts: Powerful Tools for Business Users!

Smarten

Smarten CEO, Kartik Patel says, ‘Smarten SnapShot supports the evolving role of Citizen Data Scientists with interactive tools that allow a business user to gather information, establish metrics and key performance indicators.’

Insiders

Sign Up for our Newsletter

This site is protected by reCAPTCHA and the Google Privacy Policy and Terms of Service apply.

article thumbnail

Your Ultimate Guide To Modern KPI Reports In The Digital Age – Examples & Templates

datapine

Typically presented in the form of an interactive dashboard , this kind of report provides a visual representation of the data associated with your predetermined set of key performance indicators – or KPI data, for short. Quick Ratio / Acid Test. How Do I Prepare A KPI Report? 2) Select your KPIs. Budget Variance.

KPI 223
article thumbnail

A Guide To The Methods, Benefits & Problems of The Interpretation of Data

datapine

Capable of displaying key performance indicators (KPIs) for both quantitative and qualitative data analyses, they are ideal for making the fast-paced and data-driven market decisions that push today’s industry leaders to sustainable success. To cut costs and reduce test time, Intel implemented predictive data analyses.

article thumbnail

Your Data Won’t Speak Unless You Ask It The Right Data Analysis Questions

datapine

But if you find a development opportunity, and see that your business performance can be significantly improved, then a KPI dashboard software could be a smart investment to monitor your key performance indicators and provide a transparent overview of your company’s data. This quote might sound a little dramatic.

IT 317
article thumbnail

Analytics On The Bleeding Edge: Transforming Data's Influence

Occam's Razor

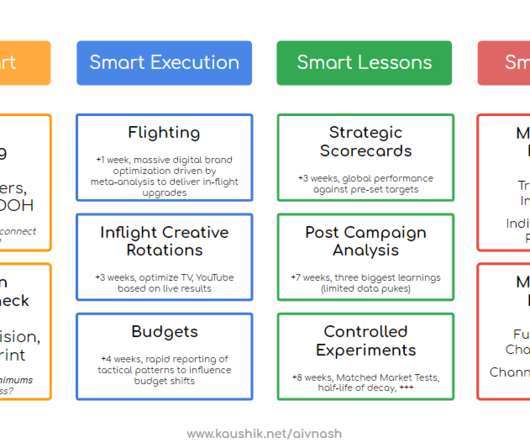
The other dimension to consider is most Analtyics teams kick into gear after the campaign is concluded, after the customer interaction has taken place in the call center, and after the funds budgeted have already been spent. The first component is a gloriously scaled global creative pre-testing program. Matched market tests.

Analytics 131
article thumbnail

The Lean Analytics Cycle: Metrics > Hypothesis > Experiment > Act

Occam's Razor

Sometimes, we escape the clutches of this sub optimal existence and do pick good metrics or engage in simple A/B testing. Testing out a new feature. Identify, hypothesize, test, react. But at the same time, they had to have a real test of an actual feature. You don’t need a beautiful beast to go out and test.

Metrics 156