Remove Interactive Remove KPI Remove Optimization Remove Visualization
article thumbnail

Take Advantage Of Operational Metrics & KPI Examples – A Comprehensive Guide

datapine

We have written about management reporting methods that can be utilized in the modern practice of creating powerful analysis, bringing complex data into simple visuals, and employ them to make actionable decisions. Your Chance: Want to visualize & track operational metrics with ease? What Is An Operational KPI?

KPI 269
article thumbnail

Top 15 Warehouse KPIs & Metrics For Efficient Management 

datapine

Table of Contents 1) What Is A Warehouse KPI? 2) Why Do You Need Warehouse KPIs? 3) Top 15 Warehouse KPIs Examples 4) Warehouse KPI Dashboard Template The use of big data and analytics technologies has become increasingly popular across industries. What Is A Warehouse KPI? Let’s dive in with the definition.

Metrics 217
Insiders

Sign Up for our Newsletter

This site is protected by reCAPTCHA and the Google Privacy Policy and Terms of Service apply.

article thumbnail

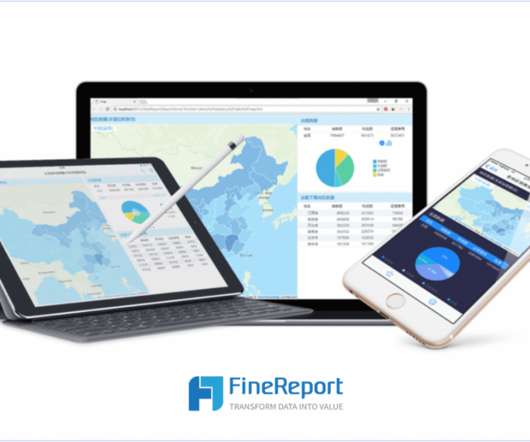
What is a KPI Report? Definition, Examples, and How-tos

FineReport

To effectively monitor and analyze these metrics, businesses utilize KPI reports. In this article, we will explore the concept of KPI reports, highlight their significance, provide examples and templates, discuss the essential components, and offer valuable insights on creating KPI reports efficiently.

KPI 52
article thumbnail

Your Introduction To CFO Dashboards & Reports In The Digital Age

datapine

Serving as a central, interactive hub for a host of essential fiscal information, CFO dashboards host dynamic financial KPIs and intuitive analytical tools, as well as consolidate data in a way that is digestible and improves the decision-making process. Your Chance: Want to build your own CFO dashboard completely free?

article thumbnail

Your Guide To Modern Agency Analytics, Dashboards & Reporting Techniques

datapine

The answer is modern agency analytics reports and interactive dashboards. Explore our 14 days free trial & benefit from interactive agency reports! Agencies benefit from interactive dashboard tools to prove the success of their strategies and campaigns to clients. What Are Agency Analytics?

article thumbnail

An Introduction To Data Dashboards: Meaning, Definition & Industry Examples

datapine

Data dashboards provide a centralized, interactive means of monitoring, measuring, analyzing, and extracting a wealth of business insights from relevant datasets in several key areas while displaying aggregated information in a way that is both intuitive and visual. Lack of different data visualization types. click to enlarge**.

article thumbnail

How To Improve Your Facility Management With Healthcare Reports

datapine

Healthcare reports, or healthcare reporting, are a data-driven means of benchmarking the performance of specific processes or functions within a healthcare institution, with the primary aim of increasing efficiency, reducing errors, and optimizing healthcare metrics. Hospital KPI dashboard. Main hospital dashboard KPIs.

Reporting 198