Remove Interactive Remove Measurement Remove Presentation Remove Visualization
article thumbnail

Take Advantage Of The Best Interactive & Effective Data Visualization Examples

datapine

Table of Contents 1) The Benefits Of Data Visualization 2) Our Top 27 Best Data Visualizations 3) Interactive Data Visualization: What’s In It For Me? 4) Static vs. Animated Data Visualization Data is the new oil? ” – David McCandless Humans are visual creatures. No, data is the new soil.”

article thumbnail

13 Essential Data Visualization Techniques, Concepts & Methods To Improve Your Business – Fast

datapine

“By visualizing information, we turn it into a landscape that you can explore with your eyes. 90% of the information transmitted to the brain is visual. Data visualization methods refer to the creation of graphical representations of information. That’s where data visualization comes in. A sort of information map.

Insiders

Sign Up for our Newsletter

This site is protected by reCAPTCHA and the Google Privacy Policy and Terms of Service apply.

Trending Sources

article thumbnail

The Top 20 Data Visualization Books That Should Be On Your Bookshelf

datapine

But often that’s how we present statistics: we just show the notes, we don’t play the music.” – Hans Rosling, Swedish statistician. Data visualization, or ‘data viz’ as it’s commonly known, is the graphic presentation of data. They can be fun and interactive, too. That’s a colossal number of books on visualization.

article thumbnail

How to Plan for Your Next Dashboard [Lea Pica’s Present Beyond Measure Podcast]

Depict Data Studio

In this article, you’ll learn how to: choose between various dashboard types (static or interactive, single or series); and deal with common dashboard challenges. Lea Pica’s Present Beyond Measure Podcast. I recently had the chance to be on the Present Beyond Measure podcast, hosted by Lea Pica.

article thumbnail

How To Present Your Market Research Results And Reports In An Efficient Way

datapine

However, today’s business world still lacks a way to present market-based research results in an efficient manner – the static, antiquated nature of PowerPoint makes it a bad choice in the matter, yet it is still widely used to present results. How To Present Your Results: 3 Market Research Example Dashboards.

Reporting 247
article thumbnail

How To Interact With Power BI Data In A PowerPoint Presentation

Smart Data Collective

Power BI proves to be the best tool for analysis and visualization of data. Microsoft Power BI is a Business Intelligence and Data Visualization tool which assists organizations to analyze data from multiple sources, convert it into an interactive dashboard and share insights. Copy-Paste Power BI Visuals in PowerPoint.

article thumbnail

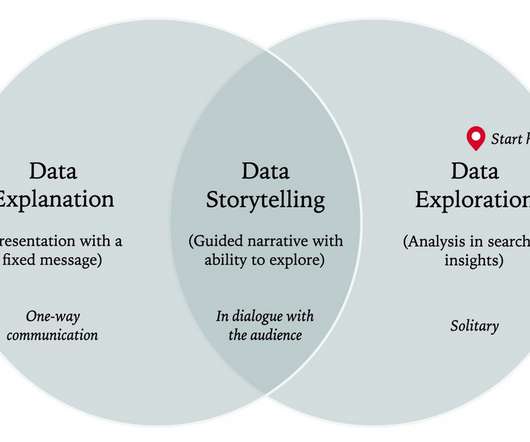
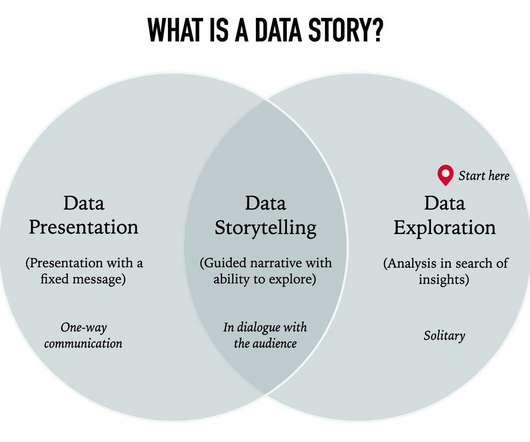
Exploratory vs. Explanatory: The Difference Between Data Analysis and Data Presentation

Juice Analytics

It is a chaotic, often solitary, exercise requiring persistence in search of insights.finding what matters in the data by connecting data sources, determining relationships within the data, and understanding what measures and dimensions are most important.the starting point for working with data. We can call it interactive data storytelling.