Remove Measurement Remove Metrics Remove Visualization Remove White Paper
article thumbnail

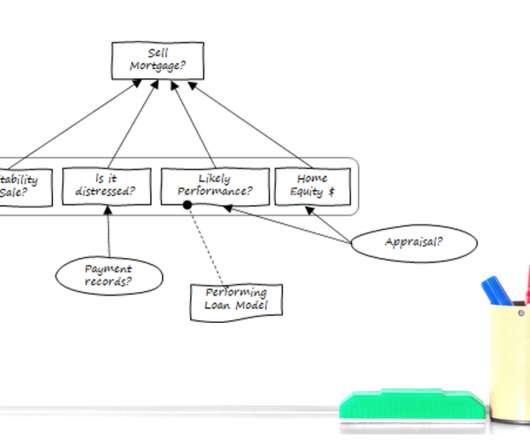
Make Your Investment in Analytic Technology Pay Off With Decision Requirements Modeling

Decision Management Solutions

Like many enterprises, you’ve likely made a hefty investment in analytic technology—from interactive dashboards and advanced visualization tools to data mining, predictive analytics, machine learning (ML), and artificial intelligence (AI). Focusing on decision-making changes everything. We can show you how to accomplish this. Get started.

article thumbnail

Transforming the Future of Learning with Analytics

Sisense

A recent study by Learning Pool revealed 76% of mature metrics practices are enabled by technology that integrates data from multiple sources. Learning Pool’s white paper Measuring the Modern Learner Experience explains how an LRS specifically stores xAPI statements, which at their most basic level combine an actor, a verb, and an object.

Insiders

Sign Up for our Newsletter

This site is protected by reCAPTCHA and the Google Privacy Policy and Terms of Service apply.

article thumbnail

The Future of AI in the Enterprise

Jet Global

Chances are good that your average non-technical sales agent or purchasing representative will have difficulty joining multiple tables together with a standard report, but with Business Intelligence cubes, all that is required drag and drop the metrics and dimensions that matter to them into their own personalized dashboard. And we can help!

article thumbnail

Building the Ultimate Sales Dashboard

Jet Global

In sales, dashboards play a huge role in managing day-to-day operations, measuring performance, and adapting quickly to changing conditions. With a well-organized dashboard designed to meet a specific goal, a sales manager can take a glance at key metrics on a single screen and make speedy decisions based on facts.

Sales 74
article thumbnail

18 Examples Of Big Data Analytics In Healthcare That Can Save People

datapine

A white paper by Intel details how four hospitals that are part of the Assistance Publique-Hôpitaux de Paris have been using data from a variety of sources to come up with daily and hourly predictions of how many patients are expected to be at each hospital. 2) Electronic Health Records (EHRs). click to enlarge**.

Big Data 364
article thumbnail

Take Advantage Of The Best Interactive & Effective Data Visualization Examples

datapine

Table of Contents 1) The Benefits Of Data Visualization 2) Our Top 27 Best Data Visualizations 3) Interactive Data Visualization: What’s In It For Me? 4) Static vs. Animated Data Visualization Data is the new oil? ” – David McCandless Humans are visual creatures. This very notion is the core of visualization.