Remove Measurement Remove Reporting Remove Snapshot Remove Visualization
article thumbnail

Why Do You Need To Visualize Your Accounting Reports?

datapine

1) What Are Accounting Reports? 2) Why Do You Need Accounting Reports? 3) Types Of Accounting Reports. 4) Accounting Reports Examples. 5) The Role Of Visuals In Accountant Reports. On the basis of every company’s competent management, we can find accounting reports. What Are Accounting Reports?

article thumbnail

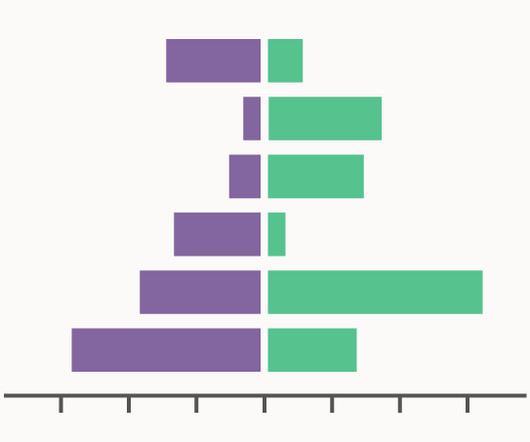
Chart Snapshot: Diverging Bar Charts

The Data Visualisation Catalogue

Not to be confused with the visually very similar Tornado Diagram or Population Pyramid. While the units of measure and value scales for each side might not always be the same, they typically should be. A Diverging Bar Chart is a visualisation of (typically) two contrasting data series displayed horizontally and side-by-side.

Insiders

Sign Up for our Newsletter

This site is protected by reCAPTCHA and the Google Privacy Policy and Terms of Service apply.

Trending Sources

article thumbnail

Top 10 Management Reporting Best Practices To Create Effective Reports

datapine

Management reporting is a source of business intelligence that helps business leaders make more accurate, data-driven decisions. But, these reports are only as useful as the work that goes into preparing and presenting them. By the end of this article, making stunning and useful managerial reports will be second nature to you.

Reporting 263
article thumbnail

Get Started With Interactive Weekly Reports For Performance Tracking

datapine

1) What Is A Weekly Report? 2) Why Are Weekly Progress Reports Important? 3) Weekly Report Templates & Examples. 4) Top Elements Of A Weekly Performance Report. This is where interactive weekly reports come into the picture. Your Chance: Want to build great weekly status reports on your own?

article thumbnail

Smarten Announces SnapShot Anomaly Monitoring Alerts: Powerful Tools for Business Users!

Smarten

Smarten announces the launch of SnapShot Anomaly Monitoring Alerts for Smarten Augmented Analytics. SnapShot Monitoring provides powerful data analytical features that reveal trends and anomalies and allow the enterprise to map targets and adapt to changing markets with clear, prescribed actions for continuous improvement.

article thumbnail

8 Examples Of Financial Reports You Can Use For Daily, Weekly, And Monthly Reports

datapine

As a business, you need the reliability of frequent financial reports to gain a better grasp of your financial status, both current and future. A robust finance report communicates crucial financial information that covers a specified period through daily, weekly, and monthly financial reports. What Is A Finance Report?

Reporting 251
article thumbnail

What Are Business Reports And Why They Are Important: Examples & Templates

datapine

Whether you manage a big or small company, business reports must be incorporated to establish goals, track operations, and strategy, to get an in-depth view of the overall company state. And business report templates are the best help for that. Your Chance: Want to test professional business reporting software?

Reporting 297