Remove Metrics Remove Statistics Remove Testing Remove Visualization
article thumbnail

Visualize data quality scores and metrics generated by AWS Glue Data Quality

AWS Big Data

It’s important for business users to be able to see quality scores and metrics to make confident business decisions and debug data quality issues. It provides insights and metrics related to the performance and effectiveness of data quality processes. We can analyze the data quality score and metrics using Athena SQL queries.

article thumbnail

Master Data Visualization Techniques: A Comprehensive Guide

FineReport

Data visualization techniques are paramount in today’s data-driven world. Mastering data visualization techniques is not just a skill but a necessity for professionals across various industries. Definition and Importance Visualizing data involves representing information through graphical elements like charts and graphs.

Insiders

Sign Up for our Newsletter

This site is protected by reCAPTCHA and the Google Privacy Policy and Terms of Service apply.

article thumbnail

The Ultimate Guide to Modern Data Quality Management (DQM) For An Effective Data Quality Control Driven by The Right Metrics

datapine

6) Data Quality Metrics Examples. Reporting being part of an effective DQM, we will also go through some data quality metrics examples you can use to assess your efforts in the matter. It involves: Reviewing data in detail Comparing and contrasting the data to its own metadata Running statistical models Data quality reports.

article thumbnail

DataOps Observability: Taming the Chaos (Part 3)

DataKitchen

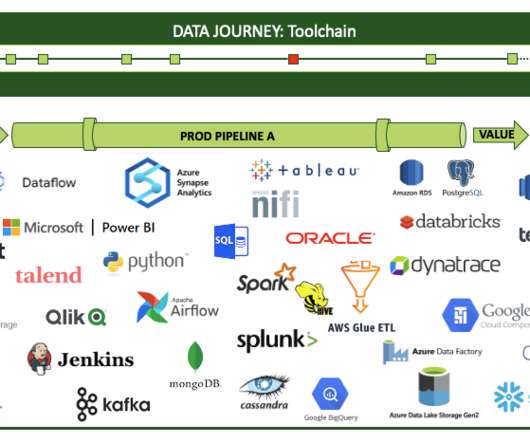
As he thinks through the various journeys that data take in his company, Jason sees that his dashboard idea would require extracting or testing for events along the way. Logs and storage for problem diagnosis and visualization of historical trends. Data and tool tests. Testing at Every Step. (Part 1) (Part 2).

Testing 130
article thumbnail

What is business analytics? Using data to improve business outcomes

CIO Business Intelligence

Business analytics is the practical application of statistical analysis and technologies on business data to identify and anticipate trends and predict business outcomes. Business analytics also involves data mining, statistical analysis, predictive modeling, and the like, but is focused on driving better business decisions.

article thumbnail

Take Complete Charge Of Customer Satisfaction Metrics – Customer Effort Score, NPS & Customer Satisfaction Score

datapine

Read here how these metrics can drive your customers’ satisfaction up! Customer satisfaction metrics evaluate how the products or services supplied by a company meet or surpass a customer’s expectations. You can use different scales to measure the experience or emojis (visual representation of satisfactory levels).

Metrics 134
article thumbnail

Optymyze CEO Discusses How To Use Data Analytics To Improve Your Business Processes

BA Learnings

This could involve analyzing customer feedback surveys or tracking website usage metrics such as pageviews or time spent on a page. This may require using tools such as Microsoft Excel or Google Sheets for fundamental statistical analysis or more advanced tools such as Tableau for visualizing complex datasets.