Remove 2012 Remove Metrics Remove Statistics Remove Testing
article thumbnail

Towards optimal experimentation in online systems

The Unofficial Google Data Science Blog

the weight given to Likes in our video recommendation algorithm) while $Y$ is a vector of outcome measures such as different metrics of user experience (e.g., Experiments, Parameters and Models At Youtube, the relationships between system parameters and metrics often seem simple — straight-line models sometimes fit our data well.

article thumbnail

Measure performance of AWS Glue Data Quality for ETL pipelines

AWS Big Data

AWS Glue Data Quality reduces the effort required to validate data from days to hours, and provides computing recommendations, statistics, and insights about the resources required to run data validation. In this post, we provide benchmark results of running increasingly complex data quality rulesets over a predefined test dataset.

Insiders

Sign Up for our Newsletter

This site is protected by reCAPTCHA and the Google Privacy Policy and Terms of Service apply.

article thumbnail

A Guide To The Methods, Benefits & Problems of The Interpretation of Data

datapine

In fact, a Digital Universe study found that the total data supply in 2012 was 2.8 More often than not, it involves the use of statistical modeling such as standard deviation, mean and median. Let’s quickly review the most common statistical terms: Mean: a mean represents a numerical average for a set of responses.

article thumbnail

Amazon DataZone now integrates with AWS Glue Data Quality and external data quality solutions

AWS Big Data

Many organizations already use AWS Glue Data Quality to define and enforce data quality rules on their data, validate data against predefined rules , track data quality metrics, and monitor data quality over time using artificial intelligence (AI). The metrics are saved in Amazon S3 to have a persistent output.

article thumbnail

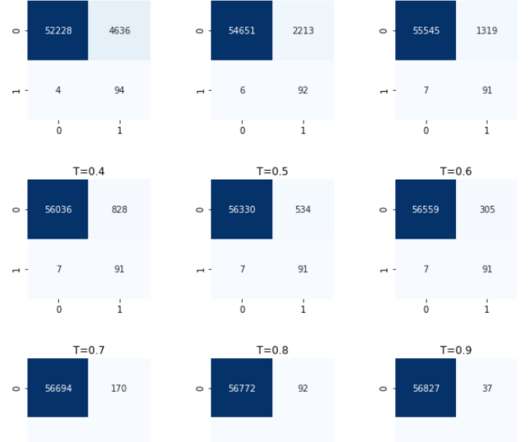
Credit Card Fraud Detection using XGBoost, SMOTE, and threshold moving

Domino Data Lab

In contrast, the decision tree classifies observations based on attribute splits learned from the statistical properties of the training data. Machine Learning-based detection – using statistical learning is another approach that is gaining popularity, mostly because it is less laborious. from sklearn import metrics.

article thumbnail

The Data Visualization Design Process: A Step-by-Step Guide for Beginners

Depict Data Studio

and implications of findings) than in statistical significance. Apply the Squint Test In these before scatter plot on the left, the cluttered appearance distracts us from the data. Apply the Squint Test. I like to test my drafts ahead of time to make sure they’ll still be legible even if they’re printed in grayscale.

article thumbnail

Unintentional data

The Unofficial Google Data Science Blog

1]" Statistics, as a discipline, was largely developed in a small data world. With more features come more potential post hoc hypotheses about what is driving metrics of interest, and more opportunity for exploratory analysis. We must correct for multiple hypothesis tests. We ought not dredge our data. And for good reason!