Remove 2013 Remove Measurement Remove Testing Remove Visualization
article thumbnail

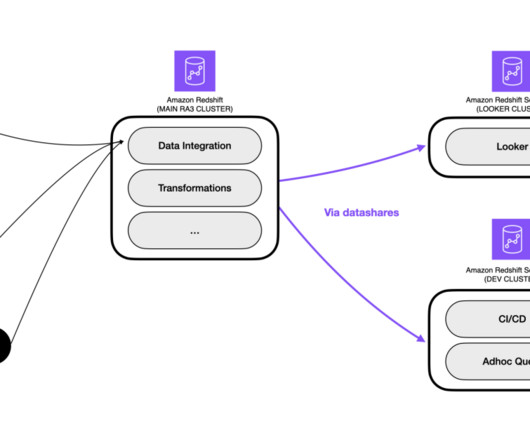
How Wallapop improved performance of analytics workloads with Amazon Redshift Serverless and data sharing

AWS Big Data

Wallapop’s initial data architecture platform Wallapop is a Spanish ecommerce marketplace company focused on second-hand items, founded in 2013. Since its creation in 2013, it has reached more than 40 million downloads and more than 700 million products have been listed. The marketplace can be accessed via mobile app or website.

article thumbnail

Leveraging MITRE ATT&CK: How Your Team Can Adopt This Essential Framework

CIO Business Intelligence

What if there were a free, globally accessible, and open framework that could help your team map attacks, visualize strengths and weaknesses in your environment, and understand where you can strengthen controls to protect critical assets against attackers? In fact, it has been available since 2013.

Insiders

Sign Up for our Newsletter

This site is protected by reCAPTCHA and the Google Privacy Policy and Terms of Service apply.

Trending Sources

article thumbnail

Why you should care about debugging machine learning models

O'Reilly on Data

In addition to newer innovations, the practice borrows from model risk management, traditional model diagnostics, and software testing. Because ML models can react in very surprising ways to data they’ve never seen before, it’s safest to test all of your ML models with sensitivity analysis. [9]

article thumbnail

Six keys to achieving advanced container monitoring

IBM Big Data Hub

Containers have increased in popularity and adoption ever since the release of Docker in 2013, an open-source platform for building, deploying and managing containerized applications. Containerization helps DevOps teams avoid the complications that arise when moving software from testing to production.

article thumbnail

Towards optimal experimentation in online systems

The Unofficial Google Data Science Blog

the weight given to Likes in our video recommendation algorithm) while $Y$ is a vector of outcome measures such as different metrics of user experience (e.g., Taking measurements at parameter settings further from control parameter settings leads to a lower variance estimate of the slope of the line relating the metric to the parameter.

article thumbnail

It's Not The Ink, It's The Think: 6 Effective Data Visualization Strategies

Occam's Razor

Delete anything that's redundant, and simply visualize what's left for sharper focus. The latter is especially important because it directly ties to what content the ads/marketing should contain, what the tone and texture should be of the landing page/app experience, and what we'll use to measure success (S, T, D, C metrics).

article thumbnail

10 Big Data Examples Showing The Great Value of Smart Analytics In Real Life At Restaurants, Bars, and Casinos

datapine

In 2017 the company wanted to take its shopping experience one step further by creating an augmented reality app that allowed users to test a product without having to leave their homes. In 2013, they took a slight risk and introduced a veggie smoothie to their previously fruit-only smoothie menu. Behind the scenes. Behind the scenes.

Big Data 244