article thumbnail

Measure performance of AWS Glue Data Quality for ETL pipelines

AWS Big Data

In this post, we provide benchmark results of running increasingly complex data quality rulesets over a predefined test dataset. Dataset details The test dataset contains 104 columns and 1 million rows stored in Parquet format. On the AWS Glue console, under ETL jobs in the navigation pane, choose Visual ETL.

article thumbnail

DirectX Visualization Optimizes Analytics Algorithmic Traders

Smart Data Collective

Learn how DirectX visualization can improve your study and assessment of different trading instruments for maximum productivity and profitability. Let’s dive right into how DirectX visualization can boost analytics and facilitate testing for you as an Algo-trader, quant fund manager, etc. But first, What is DirectX Anyway?

Insiders

Sign Up for our Newsletter

This site is protected by reCAPTCHA and the Google Privacy Policy and Terms of Service apply.

Trending Sources

article thumbnail

Top 15 Warehouse KPIs & Metrics For Efficient Management 

datapine

A Warehouse KPI is a measurement that helps warehousing managers to track the performance of their inventory management, order fulfillment, picking and packing, transportation, and overall operations. These powerful measurements will allow you to track all activities in real-time to ensure everything runs smoothly and safely.

Metrics 217
article thumbnail

Visualize data quality scores and metrics generated by AWS Glue Data Quality

AWS Big Data

AWS Glue Data Quality allows you to measure and monitor the quality of data in your data repositories. An operational scorecard is a mechanism used to evaluate and measure the quality of data processed and validated by AWS Glue Data Quality rulesets. The crawler builds a Data Catalog, so the data can be queried using Athena.

article thumbnail

A Guide To The Methods, Benefits & Problems of The Interpretation of Data

datapine

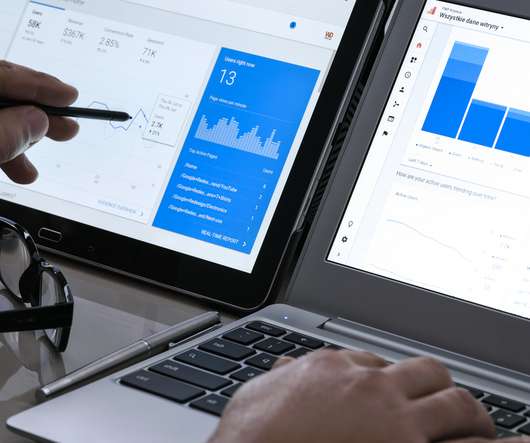
Through the art of streamlined visual communication, data dashboards permit businesses to engage in real-time and informed decision-making and are key instruments in data interpretation. Interval: a measurement scale where data is grouped into categories with orderly and equal distances between the categories.

article thumbnail

KPIs vs Metrics: Understanding The Differences With Tips & Examples

datapine

Your Chance: Want to test a professional KPI and metrics software? Essentially, Key Performance Indicators or KPIs measure performance or progress based on specific business goals and objectives. Companies usually visualize these measurements together with the help of interactive KPI reports. What Are KPIs?

Metrics 189
article thumbnail

DataOps Observability: Taming the Chaos (Part 3)

DataKitchen

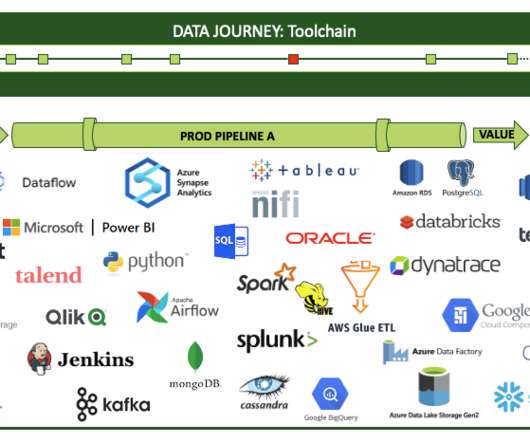
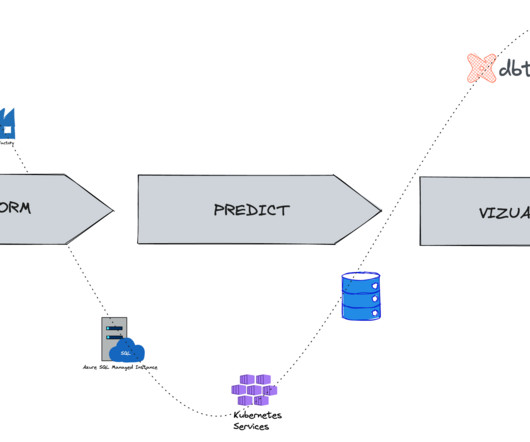
As he thinks through the various journeys that data take in his company, Jason sees that his dashboard idea would require extracting or testing for events along the way. Logs and storage for problem diagnosis and visualization of historical trends. Data and tool tests. Testing at Every Step. (Part 1) (Part 2).

Testing 130