Remove 2018 Remove Blog Remove Interactive Remove Visualization
article thumbnail

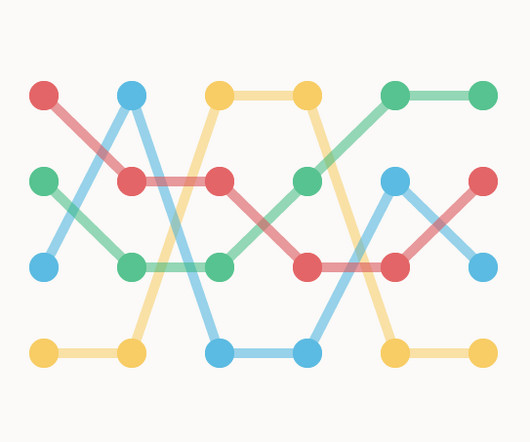
Chart Snapshot: Bump Charts

The Data Visualisation Catalogue

The key advantage of a Bump Chart is its ability to visually highlight significant rank changes, patterns, and trends over a time period for multiple categories. Interactive development & interaction design by Julia Janicki. Donna + DataViz PyeongChang 2018 Olympic Winter Games. Tools to create this chart with: D3.js

article thumbnail

VR Data Visualization: More Natural Interactions with Data

The Data Visualisation Catalogue

While researching on the Buzz Surrounding VR Data Visualization , I found the most common claim being made was that VR allows for more “Natural” interactions with the data. For long, we have relied on mice and keyboards to facilitate this sense of interactivity. How will virtual reality transform big data visualization?

Insiders

Sign Up for our Newsletter

This site is protected by reCAPTCHA and the Google Privacy Policy and Terms of Service apply.

article thumbnail

A Complete Guide To Bar Charts With Examples, Benefits, And Different Types 

datapine

2) Pros & Cons Of Bar Charts 3) When To Use A Bar Graph 4) Types Of Bar Charts 5) Bar Graphs & Charts Best Practices 6) Bar Chart Examples In today’s fast-paced analytical landscape, data visualization has become one of the most powerful tools organizations can benefit from to be successful with their analytical efforts.

article thumbnail

Create Modern SQL Dashboards With Professional Tools & Software

datapine

In some cases, you will need a coding solution where you can build your own queries, but in others, you will also look for a visual representation of your realational data. How To Create SQL Dashboards – Coding & Visuals. The good news is that you can utilize both with the help of a modern and professional SQL dashboard.

article thumbnail

Top Data Science Tools That Will Empower Your Data Exploration Processes

datapine

To fully leverage the power of data science, scientists often need to obtain skills in databases, statistical programming tools, and data visualizations. provides the user with visualizations, code editor, and debugging. Let’s get started. Exclusive Bonus Content: Download Our Free Data & Science Checklist!

article thumbnail

Clever Hans

Darkhorse

Based on a talk given at Lunchalytics in 2018. In visualization we have a vehicle capable of more than just communicating numbers. Much as Von Osten didn’t recognize Hans’ real talent, sometimes we too are blind to the strength of visualization because we’re so enamored with its capacity for numbers. SUBSCRIBE TO OUR BLOG.

article thumbnail

Take Your SQL Skills To The Next Level With These Popular SQL Books

datapine

We have already given you our top data visualization books , top business intelligence books , and best data analytics books. Originally published in 2018, the book has a second edition that was released in January of 2022. Now it’s time to ponder over our hand-picked list of the 20 best SQL learning books available today.