article thumbnail

Smarten Augmented Analytics is Named as a Representative Vendor in Gartner® 2023 ‘Market Guide for Augmented Analytics, Published October, 2023!

Smarten

Smarten is pleased to announce that its Smarten Augmented Analytics solution is included as a Representative Vendor in the Market Guide for Augmented Analytics Published October 2, 2023 (ID G00780764). The Smarten solution requires no data science skills, knowledge of statistical analysis or BI expertise.

article thumbnail

Embedded Analytics in 2023: A Year in Review

Jet Global

2023 was a big year for developers, with technology taking huge leaps forward in new and exciting areas like AI. As data grew in 2023, embedded analytics solutions scaled seamlessly to maintain performance, ensuring that analytical processes remain responsive and timely. Scalability : Think of growing data volume and performance here.

Insiders

Sign Up for our Newsletter

This site is protected by reCAPTCHA and the Google Privacy Policy and Terms of Service apply.

Trending Sources

article thumbnail

Amazon Redshift announcements at AWS re:Invent 2023 to enable analytics on all your data

AWS Big Data

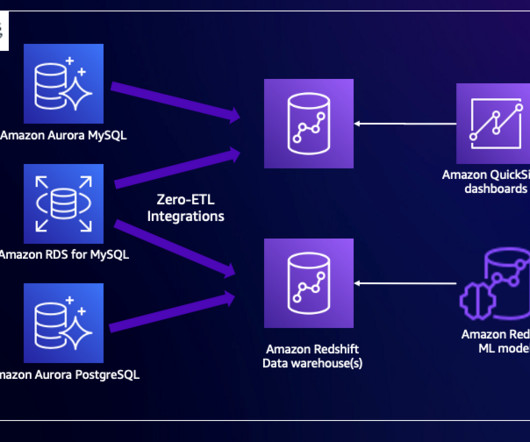
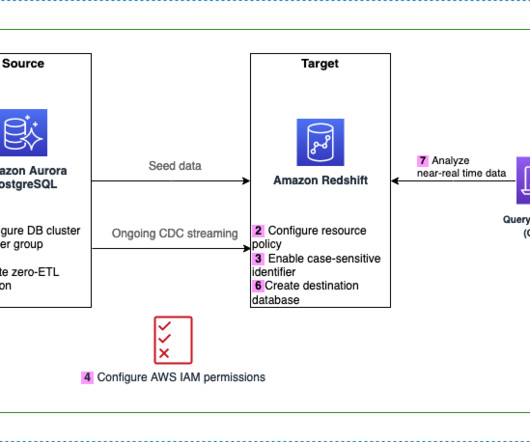
At AWS re:Invent 2023, we introduced more performance enhancements in query planning and execution such as enhanced bloom filters , query rewrites, and support for write operations in auto scaling. At AWS re:Invent 2023, we extended data sharing capabilities to launch multi-data warehouse writes in preview.

article thumbnail

10 Best Data Visualization Tools You Should Know in 2023

FineReport

In this article, we will introduce you to the 10 best data visualization tools you should know in 2023. Infogram Infogram is a drag-and-drop visualization tool that offers a range of features suitable for non-designers looking to create engaging data visualizations for marketing reports, infographics, social media posts, maps, and dashboards.

article thumbnail

Enhance monitoring and debugging for AWS Glue jobs using new job observability metrics

AWS Big Data

In addition to providing insightful dashboards, the metrics provide classification of errors, which helps with root cause analysis of performance bottlenecks and error diagnosis. On the Graphed metrics tab, configure your preferred statistic, period, and so on.

Metrics 97
article thumbnail

Maximize the power of your lines of defense against cyber-attacks with IBM Storage FlashSystem and IBM Storage Defender

IBM Big Data Hub

In 2023, the FBI received a record number of 880,418 complaints with potential losses exceeding USD 12.5 Today, cybercrime is good business. It exists because the profits are high while the risks are low. Far from stopping, cybercrime is constantly increasing.

article thumbnail

What is business intelligence? Transforming data into business insights

CIO Business Intelligence

BI tools access and analyze data sets and present analytical findings in reports, summaries, dashboards, graphs, charts, and maps to provide users with detailed intelligence about the state of the business. Business intelligence examples Reporting is a central facet of BI and the dashboard is perhaps the archetypical BI tool.