Remove Advertising Remove Dashboards Remove Interactive Remove Visualization
article thumbnail

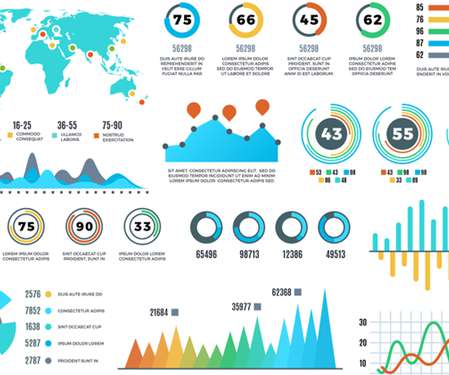
Take Advantage Of The Best Interactive & Effective Data Visualization Examples

datapine

Table of Contents 1) The Benefits Of Data Visualization 2) Our Top 27 Best Data Visualizations 3) Interactive Data Visualization: What’s In It For Me? 4) Static vs. Animated Data Visualization Data is the new oil? ” – David McCandless Humans are visual creatures. No, data is the new soil.”

article thumbnail

Get Started With Interactive Weekly Reports For Performance Tracking

datapine

This is where interactive weekly reports come into the picture. Armed with powerful visualizations and real-time data, modern weekly summary reports enable businesses to closely monitor their performance and the progress of their strategies to extract relevant insights and optimize their processes to ensure constant growth.

Insiders

Sign Up for our Newsletter

This site is protected by reCAPTCHA and the Google Privacy Policy and Terms of Service apply.

article thumbnail

The Top 20 Data Visualization Books That Should Be On Your Bookshelf

datapine

Now that you’re sold on the power of data analytics in addition to data-driven BI, it’s time to take your journey a step further by exploring how to effectively communicate vital metrics and insights in a concise, inspiring, and accessible format through the power of visualization. They can be fun and interactive, too.

article thumbnail

Mastering Data Analysis Report and Dashboard

FineReport

In the realm of big data utilization , we often romanticize its profound impact, envisioning scenarios like precision-targeted advertising, streamlined social security management, and the intelligent evolution of the pharmaceutical sector. Try FineReport Now 1.1 Try FineReport Now 1.1

article thumbnail

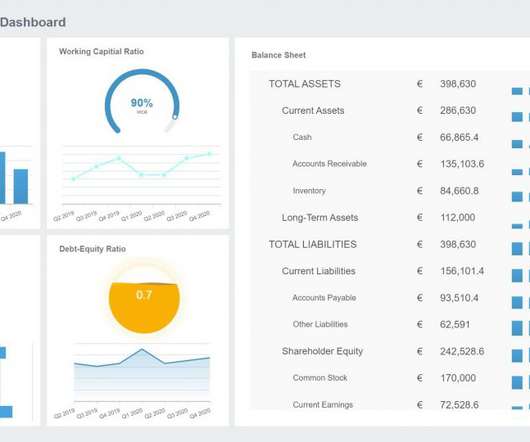
Discover Powerful Small Business Dashboards & KPIs To Track For Success

datapine

1) What Is A Small Business Dashboard? 3) Why Do You Need Small Business Dashboards. 4) Small Business Dashboard & KPIs Examples. Enter small business dashboards and metrics. BI dashboard tools provide smaller businesses with valuable insights regarding their operations thanks to real-time access to data.

article thumbnail

How Recruitment Metrics & Dashboards Can Help Improve Hiring New Candidates

datapine

By utilizing recruiting KPIs presented through the medium of visual and interactive HR dashboards , it’s possible to use recruitment metrics to better interpret and evaluate a variety of talent acquisition factors that aid in hiring processes. Exclusive Bonus Content: What are recruiting metrics & dashboards for?

Metrics 210
article thumbnail

HR Dashboard: Everything You Need To Know

FineReport

An HR dashboard functions as an advanced analytics tool that utilizes interactive data visualizations to present crucial HR metrics. By adopting a professional online dashboard, HR professionals gain the ability to closely monitor employee performance, recruitment activities, and talent management processes.